
Cost of Living in Texas
Cost of Living in Texas
(Last Updated – 03/2025)
If you’re looking to move to a state with gainful employment, look to Texas. Texas jobs are predicted to increase 1.6% in 2025, according to the Federal Reserve Bank of Dallas.
From Dallas to Austin, there are plenty of great cities to grow a career in. Alongside employment opportunities, the second-largest U.S. state offers a worldwide food scene that goes way beyond barbecue.
To learn more about what it will cost you to live in the Lone Star State, keep reading for a breakdown of the Texas cost of living.
What’s the Average Cost of Living in Texas?
Average Cost of Living in Texas: $52,299 per year
When it comes to expenses in this sprawling state, the 2024 data from MERIC found that Texans enjoy the 16th lowest cost of living in the country.
Other Southwestern states like Arizona (37th) and Utah (36th) have a much higher cost of living, while New Mexico is more similar to Texas as the state with the 19th lowest cost of living.
So how much does it cost to live in Texas? According to the latest data from the Bureau of Economic Analysis, the average total personal consumption cost in Texas is $52,299 per year. Here’s how that breaks down.
|
Category |
Average Annual Per-Capita Cost in Texas |
|
Housing and Utilities |
$9,428 |
|
Health Care |
$7,411 |
|
Food and Beverages (nonrestaurant) |
$4,123 |
|
Gas and Energy Goods |
$1,500 |
|
All Other Personal Expenditures |
$29,836 |
That’s $4,358 a month, per person, on average.
Housing Costs in Texas
Average Housing Costs in Texas: $1,252 to $2,219 per month
With more than 12 million housing units, according to U.S. census data, Texas offers plenty of places to live. The big question is, how much will it cost you to find your home sweet home? Texas’ typical home value was $299,982 in December 2024, according to Zillow.
Here’s what it looks like to rent or own on a monthly basis in Texas, per the latest data from the U.S. Census Bureau:
• Median monthly mortgage cost: $2,012
• Median studio rent: $1,252
• Median one-bedroom rent: $1,261
• Median two-bedroom rent: $1,396
• Median three-bedroom rent: $1,644
• Median four-bedroom rent: $2,129
• Median five-bedroom (or more) rent: $2,219
• Median gross rent: $1,413
Texas is a huge state. Let’s take a look at housing prices for just 20 cities, courtesy of Zillow data sourced in March 2025.
|
Texas City |
Average Home Value |
|
Beaumont |
$148,990 |
|
Waco |
$188,074 |
|
Brownsville |
$188,988 |
|
Abilene |
$190,065 |
|
Amarillo |
$196,062 |
|
Lubbock |
$199,764 |
|
Laredo |
$211,258 |
|
Corpus Christi |
$215,707 |
|
Killeen |
$217,566 |
|
McAllen |
$221,115 |
|
Longview |
$223,296 |
|
El Paso |
$224,689 |
|
Odessa |
$236,898 |
|
Tyler |
$246,618 |
|
San Antonio (San Antonio Housing Market Trends) |
$250,675 |
|
Houston (Houston Housing Market Trends) |
$265,434 |
|
Dallas (Dallas Housing Market Trends) |
$306,959 |
|
Midland |
$315,356 |
|
College Station |
$342,247 |
|
Austin (Austin Housing Market Trends) |
$517,589 |
Utility Costs in Texas
Average Utility Costs in Texas: $408 per month
Even though they aren’t the most fun bills to pay, we all need our utilities.
|
Utility |
Average Texas Bill |
|
Electricity |
$166 |
|
Natural Gas |
$61 |
|
Cable & Internet |
$118 |
|
Water |
$63 |
Sources: U.S. Energy Information Administration, Electric Sales, Revenue, and Average Price; Inspirecleanenergy.com; DoxoInsights, U.S. Cable & Internet Market Size and Household Spending Report; and Rentcafe.com, What Is the Average Water Bill?
Groceries & Food
Average Grocery & Food Costs in Texas: $343.58 per person, per month
How much you spend on food depends on many things, including the state you live in. The Bureau of Economic Analysis estimates that the average Texan spends $4,123 a year on nonrestaurant sustenance, or about $344 per month.
The specific area of a state that you live in can also affect grocery spending. The Council for Community and Economic Research, which ranks food costs in major American cities, compared grocery spending among some Texas cities for 2024. Below, the cities are ranked from lowest costs to highest costs.
|
Texas City |
Grocery Items Index |
|
Harlingen |
92.7 |
|
McAllen |
93.3 |
|
Waco |
93.3 |
|
Temple |
93.6 |
|
Amarillo |
93.7 |
|
Corpus Christi |
94.3 |
|
Nacogdoches |
94.5 |
|
San Antonio |
94.5 |
|
Odessa |
95.7 |
|
Abilene |
95.8 |
|
Tyler |
96.0 |
|
Midland |
96.1 |
|
Lubbock |
96.4 |
|
Longview |
96.5 |
|
Austin |
96.6 |
|
El Paso |
96.7 |
|
Wichita Falls |
97.3 |
|
Conroe |
97.5 |
|
Plano |
97.7 |
|
Dallas |
98.8 |
|
Fort Worth |
99.3 |
|
Houston |
99.3 |
Transportation
Average Transportation Costs in Texas: $10,165 to $18,915 per year
You’ll need to hit the open road from time to time, and your family makeup can affect how much you need to spend to get everyone where they need to go. MIT’s Living Wage Calculator estimates what you can expect to spend on transportation, based on the most recent data available.
|
Family Makeup |
Average Annual Transportation Cost |
|
One adult, no children |
$10,165 |
|
Two working adults, no children |
$11,764 |
|
Two working adults, three children |
$18,915 |
Health Care
Average Health Care Costs in Texas: $7,411 per person, per year
Each Texan spends about $7,411 a year on health care, according to the most recent Bureau of Economic Analysis Personal Consumption Expenditures by State report.
Of course, factors like specific medical needs and coverage affect how much any one person spends on health care.
Child Care
Average Child Care Costs in Texas: $719 to $1,258 or more per child, per month
Child care is a large but necessary expense for most parents, though there is some wiggle room depending on what kind of care you’re seeking.
State resources can help make financing child care easier. For example, the Texas Workforce Commission has a program that subsidizes child care for low-income families so parents can work or pursue an education.
These are the average child care costs you can expect to encounter in Texas, according to the latest data from CostofChildCare.org.
|
Type of Child Care |
Average Cost Per Month, Per Child |
|
Infant Classroom |
$1,254 |
|
Toddler Classroom |
$816 |
|
Preschooler Classroom |
$719 |
|
Home-Based Family Child Care |
$1,258 |
Taxes
State Tax Rate: None
Texas doesn’t charge any state income tax, as noted by the Tax Foundation’s 2025 overview of state individual income tax rates and brackets. Florida, Tennessee, South Dakota, Wyoming, Nevada, New Hampshire, Washington, and Alaska also don’t charge state income tax.
If you’re moving from a state with high income taxes like New Jersey (top marginal rate, 10.75%) or California (top rate, 13.3%), then Texas might look like a pretty smart move.
Miscellaneous Costs
You’ve paid for the basics, and now it’s time to have a little fun. The Bureau of Economic Analysis estimates that every Texan spends $29,836 a year on personal expenditures.
These are a few examples of what it can cost to check out Texas pleasures (costs are as of March 2025).
• Tickets to the Space Center Houston: $0 to $44.95, depending on age of visitor
• Family membership to the Houston Zoo: $149 to $349, depending on pass type
• Dinner at Fort Worth fan favorite Goldee’s Bar-BQ: $16 for a half-pound brisket
And remember the Alamo, in San Antonio. Church entry is free; you can book a tour of the complex for $10 and up.
Recommended: What Are the Average Monthly Expenses for a Single Person?
How Much Money Do You Need to Live Comfortably in Texas?
Only you can decide what it truly means to live comfortably by your standards, but U.S. News & World Report’s Affordability Rankings can give you a pretty good idea of how affordable a state is to live in.
Texas lands 28th on that list of 50, so it’s neither one of the hardest nor easiest places in which to live comfortably. MERIC identified Texas as the 16th most affordable state to live in. Conclusion: Depending on your lifestyle choices, Texas can be easy to live in comfortably.
You’ll want to create a budget to make sure moving to Texas works out in your bank account’s favor.
What City Has the Lowest Cost of Living in Texas?
Digging through the latest Council for Community and Economic Research’s Cost of Living Index yielded the three most affordable major cities in Texas.
Harlingen
Per the latest census count, Harlingen has about 72,000 residents, yet it houses a convention center and plenty of dining and shopping options. The research council found Harlingen to be Texas’ most affordable major city, with a cost-of-living index of 82.1. Redfin listed a typical home value in this city near the Mexican border at about $193,000 at the end of 2024.
Amarillo
If you’re looking for cowboy vibes, Amarillo (cost-of-living index of 83.3) might just be the perfect place for you to call home. This historic city in the Texas panhandle’s high plains is full of both working Western ranches and modern businesses. As noted above, Zillow listed a typical home price in Amarillo of about $203,686 at the end of 2024.
McAllen
With a cost-of-living index of 85.1, McAllen is the third-most-affordable city in Texas. People travel from around the world to check out the roughly 360 species of birds and more than 300 butterfly species that can be seen in and around this border city. There are also plenty of art and nightlife opportunities. Zillow gave a typical home price of $187,270 in December 2024, as mentioned above.
SoFi Home Loans
The Texas cost of living is lower than that of many other states. Good Tex-Mex eats, no state income tax, and moderate home prices beckon newcomers.
Looking for an affordable option for a home mortgage loan? SoFi can help: We offer low down payments (as little as 3% - 5%*) with our competitive and flexible home mortgage loans. Plus, applying is extra convenient: It's online, with access to one-on-one help.
FAQ
How much money do you need to live comfortably in Texas?
That likely depends on your lifestyle, family, and where you live. The Bureau of Economic Analysis estimates the expense of living in Texas to be just under $52,300 per person. But if you’re living in a bigger city, want to enjoy a few luxuries, and even save a bit, a 50/30/20 budget would call for about $65,000 or more. A budgeting app can help you stay on track.
Which city in Texas has the lowest cost of living?
Harlingen is a low-cost standout in the Lone Star State, with a cost of living 7% lower than the national average. But Amarillo, Abilene, and Nacogdoches are also budget-friendly. From housing to groceries and utilities, these cities can help you stretch your dollar.
What is the average house cost in Texas?
The average home value is $299,787, according to Zillow’s figures for March 2025. But prices vary widely. The table above showing average home values in 20 cities shows how big a difference location can make.
Photo credit: iStock/dszc
SoFi Mortgages
Terms, conditions, and state restrictions apply. Not all products are available in all states. See SoFi.com/eligibility-criteria for more information.
SoFi Loan Products
SoFi loans are originated by SoFi Bank, N.A., NMLS #696891 (Member FDIC). For additional product-specific legal and licensing information, see SoFi.com/legal. Equal Housing Lender.
*SoFi requires Private Mortgage Insurance (PMI) for conforming home loans with a loan-to-value (LTV) ratio greater than 80%. As little as 3% down payments are for qualifying first-time homebuyers only. 5% minimum applies to other borrowers. Other loan types may require different fees or insurance (e.g., VA funding fee, FHA Mortgage Insurance Premiums, etc.). Loan requirements may vary depending on your down payment amount, and minimum down payment varies by loan type.
Tax Information: This article provides general background information only and is not intended to serve as legal or tax advice or as a substitute for legal counsel. You should consult your own attorney and/or tax advisor if you have a question requiring legal or tax advice.
Third-Party Brand Mentions: No brands, products, or companies mentioned are affiliated with SoFi, nor do they endorse or sponsor this article. Third-party trademarks referenced herein are property of their respective owners.
External Websites: The information and analysis provided through hyperlinks to third-party websites, while believed to be accurate, cannot be guaranteed by SoFi. Links are provided for informational purposes and should not be viewed as an endorsement.
Qualifying for the reward requires using a real estate agent that participates in HomeStory’s broker to broker agreement to complete the real estate buy and/or sell transaction. You retain the right to negotiate buyer and or seller representation agreements. Upon successful close of the transaction, the Real Estate Agent pays a fee to HomeStory Real Estate Services. All Agents have been independently vetted by HomeStory to meet performance expectations required to participate in the program. If you are currently working with a REALTOR®, please disregard this notice. It is not our intention to solicit the offerings of other REALTORS®. A reward is not available where prohibited by state law, including Alaska, Iowa, Louisiana and Missouri. A reduced agent commission may be available for sellers in lieu of the reward in Mississippi, New Jersey, Oklahoma, and Oregon and should be discussed with the agent upon enrollment. No reward will be available for buyers in Mississippi, Oklahoma, and Oregon. A commission credit may be available for buyers in lieu of the reward in New Jersey and must be discussed with the agent upon enrollment and included in a Buyer Agency Agreement with Rebate Provision. Rewards in Kansas and Tennessee are required to be delivered by gift card.
HomeStory will issue the reward using the payment option you select and will be sent to the client enrolled in the program within 45 days of HomeStory Real Estate Services receipt of settlement statements and any other documentation reasonably required to calculate the applicable reward amount. Real estate agent fees and commissions still apply. Short sale transactions do not qualify for the reward. Depending on state regulations highlighted above, reward amount is based on sale price of the home purchased and/or sold and cannot exceed $9,500 per buy or sell transaction. Employer-sponsored relocations may preclude participation in the reward program offering. SoFi is not responsible for the reward.
SoFi Bank, N.A. (NMLS #696891) does not perform any activity that is or could be construed as unlicensed real estate activity, and SoFi is not licensed as a real estate broker. Agents of SoFi are not authorized to perform real estate activity.
If your property is currently listed with a REALTOR®, please disregard this notice. It is not our intention to solicit the offerings of other REALTORS®.
Reward is valid for 18 months from date of enrollment. After 18 months, you must re-enroll to be eligible for a reward.
SoFi loans subject to credit approval. Offer subject to change or cancellation without notice.
The trademarks, logos and names of other companies, products and services are the property of their respective owners.
SOHL-Q125-135

Cost of Living in Vermont
Cost of Living in Vermont
By Kenny Zhu
(Last Updated – 03/2025)
Vermont is a beautiful lush green state with over 4.5 million acres of pristine, undisturbed forestland. There are only four cities in the state with over 10,000 people, as most of Vermont’s population is spread out across its sparsely populated farms and woodlands.
Vermont also has the second-lowest population in the U.S. with just about 648,500 residents; only Wyoming has a lower population. If you despise bumper-to-bumper traffic or are just looking for a scenic remote location to get away, Vermont could be the perfect state for you.
The fact that Vermont isn’t the most expensive state for its region makes it an attractive draw to those who live in neighboring states, especially nearby folks living in high-cost Massachusetts and New York. However, if you’re thinking of moving up to Vermont, you’ll want to keep an eye on those taxes and utility costs (heating a home in the deep New England winter isn’t cheap).
Let’s take a deep dive into the cost of living in Vermont.
What’s the Average Cost of Living in Vermont?
Average Cost of Living in Vermont: $58,958 per year
According to the Bureau of Economic Analysis (BEA), the average cost of living in Vermont for a typical individual is around $58,958 per year.
Vermont has an above-average cost of living when compared to the rest of the United States, but this is normal in New England, as the region ranks above the rest of the nation in terms of expenses.
Vermont was the second most expensive New England state to live in, beating out only Massachusetts, in addition to its western neighbor of New York, which just so happens to be one of the most expensive states in the country.
When ranking states from lowest cost of living to highest in 2024, MERIC placed Vermont 44th, largely due to the above-average cost of housing and utilities in the Green Mountain State. In the New England region, Maine, Rhode Island, Connecticut, and New Hampshire ranked slightly cheaper, at 39th through 42nd, respectively.
How does this look in terms of your everyday costs? The latest data from the BEA breaks down the typical per capita personal consumption expenses on an annual level:
|
Category |
Average Annual Per-Capita Cost in Vermont |
|
Housing and Utilities |
$10,195 |
|
Health Care |
$10,438 |
|
Food and Beverages (nonrestaurant) |
$5,107 |
|
Gas and Energy Goods |
$1,654 |
|
All Other Personal Expenditures |
$31,564 |
Housing Costs in Vermont
Average Housing Costs in Vermont: $1,025 to $1,877 per month
The typical home in Vermont cost $385,992 at the end of December 2024, which is higher than the $355,328 average home value for the United States, according to Zillow. Vermont boasts a supply of 341,375 houses according to the most recent data from the U.S. Census Bureau.
Here are the median mortgage and rental costs for residents in Vermont:
• Median monthly mortgage cost: $1,877
• Median studio rent: $1,025
• Median one-bedroom rent: $1,026
• Median two-bedroom rent: $1,337
• Median three-bedroom rent: $1,484
• Median four-bedroom rent: $1,426
• Median gross rent: $1,202
Given the sprawling nature of the state, there are wide discrepancies in home values across various communities. Expect to pay more for choice properties near Burlington relative to smaller towns like Bennington or Rutland.
|
Vermont City |
Average Home Value |
|
Burlington |
$461,190 |
|
Barre |
$379,401 |
|
Rutland |
$295,729 |
|
Bennington |
$361,797 |
Utility Costs in Vermont
Average Utility Costs in Vermont: $357 per month
Real Vermonters own multiple flannel shirts, and it’s no surprise why. When compared to the rest of the nation, Vermont’s deep winters and muddy spring seasons are part of the reason why it has above-average utility costs. Utility costs take up a large part of Vermont’s cost of living, and prospective homebuyers should be wary.
While gas heating costs run an average of $89 per month, in the winter peak seasons that figure can easily multiply. It’s no wonder why many Vermont households have resorted to heating their homes with firewood; it’s one of the most popular heating fuels in the state!
Despite the high utility costs, conservationists will be proud to learn that Vermont leads the nation in renewable energy production, as it generated almost 100% of the electricity output from renewable resources in the year 2023. This includes wind, solar, hydroelectric, and biomass, according to data released by the U.S. Energy Information Administration (EIA).
It doesn’t stop there, however, as the state pledged to achieve at least 90% of its energy usage from renewable resources by the year 2050. So even if the bill is a little high, you can feel good about where the energy came from.
|
Utility |
Average Vermont Bill |
|
Electricity |
$117 |
|
Gas |
$89 |
|
Cable & Internet |
$134 |
|
Water |
$17 |
Sources: U.S. Energy Information Administration, Electric Sales, Revenue, and Average Price; Inspirecleanenergy.com; DoxoInsights, U.S. Cable & Internet Market Size and Household Spending Report; and Rentcafe.com, What Is the Average Water Bill?
Groceries & Food
Average Grocery & Food Costs in Vermont: $425.58 per person, per month
The average individual will spend around $425 per month on food and groceries, or $5,107 per year, according to the BEA. This is slightly above average for the New England region, which already has some of the highest food costs in the nation.
Out of all 6 New England states, Vermonters pay on the higher end for food and groceries. In fact, Vermont has some of the highest food and beverage costs in the nation.
Of course, food costs can vary widely depending on where you live. Burlington, Vermont’s biggest city, was at the high end for grocery costs when compared to other major New England cities.
The Council for Community and Economic Research ranks food expenses for major metropolitan areas within the United States. We’ve displayed the comparative level of grocery prices for some New England cities in the table below.
|
City |
Grocery Items Index |
|
Manchester, NH |
99.9 |
|
New Haven, CT |
101.0 |
|
Portland, ME |
101.5 |
|
Providence, RI |
101.9 |
|
Hartford, CT |
102.0 |
|
Boston, MA |
104.4 |
|
Stamford, CT |
104.7 |
|
Burlington, VT |
106.2 |
Transportation
Average Transportation Costs in Vermont: $10,602 to $19,729 per year
Vermonters drive fast, and true Vermonters know that the distance between towns isn’t measured in miles, it’s measured in hours. So it’s probably a good thing that Vermont’s transportation costs aren’t expensive. In fact, U.S. News named Vermont as the 3rd cheapest state in the country when it comes to auto insurance.
With the state’s low population and spread-out communities, bumper-to-bumper traffic in Vermont is almost unheard of. What qualifies as rush-hour traffic in Vermont might compare to a leisurely weekend cruise in major cities like New York. The reduced hours spent waiting in traffic go a long way toward cutting transportation costs.
Here’s a breakdown of the average annual transportation costs by family size, according to MIT’s Living Wage Calculator.
|
Family Makeup |
Average Annual Transportation Cost |
|
One adult, no children |
$10,602 |
|
Two working adults, no children |
$12,270 |
|
Two working adults, three children |
$19,729 |
Health Care
Average Health Care Costs in Vermont: $10,438 per person, per year
The average Vermonter pays around $10,438 per year for health care, according to the BEA’s latest personal consumption expenditures report. This makes up a significant part of Vermont’s cost of living for its large population of citizens over the age of 50.
Vermont’s average health care costs fall on the higher end of the scale when compared to the rest of the nation, but they’re around average when compared to its peers in the New England region. Only its neighbor Massachusetts has higher average health care costs.
As a whole, the New England region collectively has the highest health care costs of any geography in the United States. Residents of Vermont who want to save on health care expenses can shop for and compare health insurance providers through Vermont’s state-sponsored exchange, Vermont Health Connect.
Child Care
Average Child Care Costs in Vermont: $1,038 to $1,742 or more per child, per month
Child care is an expense that cannot be avoided for families, although the average costs may vary depending on the type of care you seek. In Vermont, home-based family child care is actually less expensive than classroom-based child care for both infants and toddlers, according to costs cited by CostofChildCare.org.
Generally, child care costs that make up 7% or less of a household’s income are defined as “affordable” by the U.S. Department of Health and Human Services (HHS). However, this metric may still be difficult for some families to achieve.
For struggling parents in need, Vermont’s Agency for Human Services offers help for struggling parents through its Child Care Financial Assistance Program in the form of subsidies and financial assistance.
|
Type of Child Care |
Average Cost Per Month, Per Child |
|
Infant Classroom |
$1,742 |
|
Toddler Classroom |
$1,508 |
|
Preschooler Classroom |
$1,038 |
|
Home-Based Family Child Care |
$1,216 |
Taxes
Highest Marginal Tax Rate in Vermont: 8.75%
The state of Vermont uses a graduated income tax system which caps out at 8.75% for the highest income bracket. This is the 8th highest rate in the nation when it comes to income taxes.
Vermont was also ranked as having the 4th highest tax burden according to the Tax Foundation, with an effective tax rate of 13.6%. Keep in mind that “tax burden” measures all taxes reported through the U.S. Census Bureau, including but not limited to property, excise, estate, and income taxes.
When compared to its New England neighbors, Vermont was second only to Connecticut, which came in with a higher tax burden at 15.4%. The only other New England state in the top 10 was Maine, with a tax burden of 12.4%. New York, Vermont’s western neighbor, happens to have the highest effective tax burden in the country: 15.9%.
Miscellaneous Costs
In addition to the mundane everyday costs, let’s take a look at how much some of the Green Mountain State’s best-known attractions cost:
• 8-oz. bar Cabot Creamery Vermont Sharp cheddar cheese: $4.99
• 1 gallon jug of Vermont maple syrup: $33.10
• Unlimited adult season pass to Mt. Killington (Winter): $1,089 – $1,779
• Pint of Ben & Jerry’s ice cream: $6.99
• Public brewery tour in Burlington: $99 per person
• Men’s classic flannel shirt from the Vermont Flannel Company: $88.80
Whether you’re coming to town for some sightseeing or you’re looking to hit the slopes at one of its 25 ski resorts, Vermont has something for everyone.
When it comes to cheese and syrup, real Vermonters know how to tell home-grown Vermont cheddar and maple from Velveeta and Aunt Jemima. No state does farm-to-table better than this one, as Vermont is known for its ubiquitous dairy farms and farmers’ markets.
The world-famous Ben & Jerry’s ice cream company also calls Vermont home. If you’re visiting, try dropping by at the Ben & Jerry’s factory in Waterbury, or check out any of their 40+ flavors of ice cream at one of their locations in Vermont.
Finally, Vermont is a beer aficionado’s paradise. Experts attest that its climate is ideal for beer-brewing and cider-making. This is evidenced by the presence of 74 craft breweries across the state, according to the Vermont Brewers Association. Vermont competes neck and neck with nearby Maine for the honor of having the most breweries per capita in the nation, having held the title several times in recent years.
How Much Money Do You Need to Live Comfortably in Vermont?
MIT’s Living Wage Calculator notes that a single, childless person working 40 hours per week, for 52 weeks per year, would need to make at least $23.95 per hour, or $49,816 per year, to earn a “living wage.” However, the exact amount needed to live “comfortably” depends on your own unique tastes and habits.
Vermont ranks 31st in the U.S. News & World Report affordability rankings, which compares the median household income in a given state vs. the U.S. median. While this may sound expensive for the average American, Vermont still ranks ahead of Connecticut, Rhode Island, New Hampshire, and Massachusetts on the affordability chart for the New England region.
As a whole, New England does poorly on affordability, and Vermont’s rankings are fairly typical for its area. MERIC’s cost of living data series arrives at a similar conclusion, ranking Vermont 44th, which is slightly more expensive than New Hampshire but a good bit more affordable than Massachusetts.
What Cities Have the Lowest Cost of Living in New England?
To help you compare the cost of living in Vermont with its neighbors, we’ve collected data for major cities in the New England region from the Council for Community and Economic Research (CCER). The CCER tracks the cost of living in major metropolitan areas across the United States. We’ve included their results for the New England area below:
Hartford, Connecticut
The capital of Connecticut, and its 4th largest city by population, has the lowest cost of living in New England, according to the most recent data from the CCER. This is largely due to its low housing and transportation costs vs. other New England cities. In fact, Hartford has the most affordable housing in the index when compared to other New England cities rated by the CCER.
New Haven, Connecticut
The coastal city of New Haven, Connecticut, ranks as New England’s second most affordable, per the CCER’s cost of living index. Credit goes to its housing and grocery costs, which are the second-lowest among New England metros (and in line with the national average). However, in a region where utility costs are traditionally high, New Haven’s utilities are among the priciest.
SoFi Home Loans
The Green Mountain State has a little something for everyone, especially if you’re looking for a cozy destination to enjoy a beer in your flannels by a cracking fire. The cost of living in Vermont isn’t cheap, but it’s clear to see why skiers and nature lovers would call this state home.
Looking for an affordable option for a home mortgage loan? SoFi can help: We offer low down payments (as little as 3% - 5%*) with our competitive and flexible home mortgage loans. Plus, applying is extra convenient: It's online, with access to one-on-one help.
Photo credit: iStock/SeanPavonePhoto
SoFi Mortgages
Terms, conditions, and state restrictions apply. Not all products are available in all states. See SoFi.com/eligibility-criteria for more information.
SoFi Loan Products
SoFi loans are originated by SoFi Bank, N.A., NMLS #696891 (Member FDIC). For additional product-specific legal and licensing information, see SoFi.com/legal. Equal Housing Lender.
*SoFi requires Private Mortgage Insurance (PMI) for conforming home loans with a loan-to-value (LTV) ratio greater than 80%. As little as 3% down payments are for qualifying first-time homebuyers only. 5% minimum applies to other borrowers. Other loan types may require different fees or insurance (e.g., VA funding fee, FHA Mortgage Insurance Premiums, etc.). Loan requirements may vary depending on your down payment amount, and minimum down payment varies by loan type.
Tax Information: This article provides general background information only and is not intended to serve as legal or tax advice or as a substitute for legal counsel. You should consult your own attorney and/or tax advisor if you have a question requiring legal or tax advice.
Third-Party Brand Mentions: No brands, products, or companies mentioned are affiliated with SoFi, nor do they endorse or sponsor this article. Third-party trademarks referenced herein are property of their respective owners.
External Websites: The information and analysis provided through hyperlinks to third-party websites, while believed to be accurate, cannot be guaranteed by SoFi. Links are provided for informational purposes and should not be viewed as an endorsement.
Qualifying for the reward requires using a real estate agent that participates in HomeStory’s broker to broker agreement to complete the real estate buy and/or sell transaction. You retain the right to negotiate buyer and or seller representation agreements. Upon successful close of the transaction, the Real Estate Agent pays a fee to HomeStory Real Estate Services. All Agents have been independently vetted by HomeStory to meet performance expectations required to participate in the program. If you are currently working with a REALTOR®, please disregard this notice. It is not our intention to solicit the offerings of other REALTORS®. A reward is not available where prohibited by state law, including Alaska, Iowa, Louisiana and Missouri. A reduced agent commission may be available for sellers in lieu of the reward in Mississippi, New Jersey, Oklahoma, and Oregon and should be discussed with the agent upon enrollment. No reward will be available for buyers in Mississippi, Oklahoma, and Oregon. A commission credit may be available for buyers in lieu of the reward in New Jersey and must be discussed with the agent upon enrollment and included in a Buyer Agency Agreement with Rebate Provision. Rewards in Kansas and Tennessee are required to be delivered by gift card.
HomeStory will issue the reward using the payment option you select and will be sent to the client enrolled in the program within 45 days of HomeStory Real Estate Services receipt of settlement statements and any other documentation reasonably required to calculate the applicable reward amount. Real estate agent fees and commissions still apply. Short sale transactions do not qualify for the reward. Depending on state regulations highlighted above, reward amount is based on sale price of the home purchased and/or sold and cannot exceed $9,500 per buy or sell transaction. Employer-sponsored relocations may preclude participation in the reward program offering. SoFi is not responsible for the reward.
SoFi Bank, N.A. (NMLS #696891) does not perform any activity that is or could be construed as unlicensed real estate activity, and SoFi is not licensed as a real estate broker. Agents of SoFi are not authorized to perform real estate activity.
If your property is currently listed with a REALTOR®, please disregard this notice. It is not our intention to solicit the offerings of other REALTORS®.
Reward is valid for 18 months from date of enrollment. After 18 months, you must re-enroll to be eligible for a reward.
SoFi loans subject to credit approval. Offer subject to change or cancellation without notice.
The trademarks, logos and names of other companies, products and services are the property of their respective owners.
SOHL-Q125-134
Net Pay Calculator
Net Pay Calculator
By SoFi Editors | October 6, 2025
Curious about how your total pay translates into net pay? You’re in the right place. The difference between the amount you earn and what lands in your bank account each pay period can be surprisingly significant. Using an online calculator to figure out your net pay can help you understand your take-home pay and budget more effectively.
Key Points
• A net pay calculator can accurately estimate take-home pay, though not necessarily the exact amount.
• Gross income is your total annual salary, while net pay reflects money after taxes and other deductions are taken.
• Filing status impacts tax withholding and net pay.
• A net pay calculator can consider federal, state, and local taxes.
• Understanding net pay aids budgeting and financial planning.
Calculator Definitions
Before starting to use a net pay calculator, familiarize yourself with some of the key terms used to get the best results.
•Gross income: This is your total annual salary, such as $110,000.
•FICA taxes: These are the mandatory Social Security and Medicare deductions taken, equal to 7.65% of your salary.
•Federal effective tax rate: You may also hear the effective tax rate referred to as the blended tax rate that you pay on your income in the U.S.’s progressive tax system. It’s worth noting that heads of household may have a different withholding than what the calculator shows, as their tax rates can vary.
•State and local effective tax rate: The calculator’s effective state and local tax rate is the actual percentage of your income that’s paid in state and local taxes. Using this versus the marginal rates can reveal a more accurate picture of your tax burden. The effective rate takes into account the different tax brackets that apply to your income. You can look up your state income tax information on the Tax Foundation’s site.
•Annual pretax deductions: These paycheck deductions are made before taxes are withheld, reducing your taxable income and saving you about 30 cents on the dollar. This category can include health insurance, FSA or HSA, 401(k), and garnishments.
•Annual after-tax deductions: These deductions are subtracted from your pay after income, Social Security, and Medicare taxes have been taken out. Examples of after-tax deductions include ROTH accounts, charitable deductions, and disability and life insurance premiums. They are a convenient, automatic way to pay expenses, but they don’t save you money on taxes.
How to Use the Net Pay Calculator
Using the net pay calculator is quite simple. First, enter the following information:
Input Your Gross Income
Here, you’ll enter your annual total income, without any deductions.
Type in Your Federal Effective Tax Rate
As noted briefly above, the U.S. has a progressive tax system, meaning different portions of the money you earn are taxes at varying rates. This is expressed through a system of tax brackets, which change annually and can be found on the Internal Revenue Service (IRS) website. You’ll find that the effective tax rate, or percentage of your income that you pay in federal taxes, tends to be lower than the marginal tax rate, or the highest amount of tax you pay on a portion of your income.
Input Your State and Local Effective Tax Rate
As with federal taxes, you will want to research your state and local taxes and add the correct percentage to the net pay calculator. A simple way to find your state effective tax rate is to use the information available on the Tax Foundation’s website, as noted above. It provides a detailed downloadable chart that allows you to check your effective state tax rate.
Enter Annual Pretax Deductions
Some deductions are taken from your gross salary and thereby reduce your taxable income. These include such benefits as Traditional 401(k) and SEP IRA contributions; health, vision, and dental insurance premiums; commuter benefits; and FSA and HSA account contributions.
Remember to deduct the annual figure vs. how much is taken out per pay period.
Account for Annual After-Tax Deductions
The calculator will deduct 7.65% for FICA taxes (Social Security and Medicare). These are mandatory deductions. As with federal and state and local taxes, FICA is calculated on the amount of income you have after the pretax deductions are subtracted.
Once you enter this information, the calculator will tell you your annual net pay. You can divide that figure, depending on how often you are paid, to see how much you receive per pay period as take-home pay.
Worth noting: While very accurate and useful for scoping out various scenarios, a net pay calculator may not give the precise amount of your take-home pay. There may be deductions that are unique to your situation and not fully accounted for. Check your paystub if you need the exact figure.
Recommended: Navigating Needs vs Wants
Benefits of Using a Net Pay Calculator
Using a net take-home pay calculator can offer several benefits.
• Fast calculations: A net pay calculator does the math for you, saving you the trouble of doing the work by hand or punching numbers into your phone’s calculator app.
• Understanding your take-home pay: By knowing how much money you actually receive versus your total pay, you can make a budget effectively and stay in control of your finances.
• Optimizing your financial planning: When you know your net pay, you can see how, say, putting more money into a 529 account for your child could impact your financial status. You might also project how your take-home pay would increase if you got a raise or took a new, higher-paying job.
• Making wiser employee benefit choices: Once you understand your net pay, you might want to adjust your benefits. For example, perhaps you realize you have enough financial breathing room to put more money into your retirement savings. Or if money is tight, you might want to opt for a less costly health insurance plan next year.
How to Use Net Pay Calculator Data to Your Advantage
Once you use a net pay calculator, you can leverage your learning in a variety of ways. You can play out different budgeting techniques and financial planning scenarios to see what works best for your finances. For instance, you might take a fresh look at your spending categories and adjust them based on your current habits. Or maybe you realize that putting more money into a pretax retirement plan could help lower your taxable income.
Other possibilities: You can negotiate for a raise more knowledgeably after evaluating just how much a new salary would change your finances. And you can make more informed decisions about your tax withholding and benefit choices.
What Is an Effective Federal Tax Rate?
Your effective federal tax rate, or blended rate, reveals the actual percentage of your total income that you pay toward federal taxes. As mentioned above, the U.S. has a progressive tax system with tax brackets for different levels of income. The tax rate applied to your last dollar of taxable income is called your marginal rate.
Here are the brackets for individuals in the 2025 tax year:
• 10% for incomes from $0 to $11,925 ($0 to $23,850 for married couples filing jointly)
• 12% for incomes of $11,926 to $48,475 ($23,851 to $96,950 for married couples filing jointly)
• 22% for incomes of $48,476 to $103,350 ($96,951 to $206,700 for married couples filing jointly)
• 24% for incomes of $103,351 to $197,300 ($206,701 to $394,600 for married couples filing jointly).
• 32% for incomes of $197,301 to $250,525 ($394,601 to $501,050 for married couples filing jointly).
• 35% for incomes of $250,526 and higher ($501,051 and higher for married couples filing jointly).
Your effective tax rate is the weighted average of the different federal tax brackets. For anyone making more than $11,925 a year, their effective tax rate will be lower than their marginal tax rate. For example, for a single filer making $100,000, their effective tax rate is about 16.9%.
Effective Federal Tax Rates by Income
Here’s an example of how effective federal tax rates work. Say you earned $100,000 in the 2025 tax year.
• Because the 10% (or lowest) tax bracket includes earnings up to $11,925, the first $11,925 of your income is taxed at this rate, equaling $1,192.50.
• The next tax bracket covers earnings from $11,926 to $48,475, so that segment of your income is taxed at 12%, or $4,386.
• The next bracket runs from $48,476 to $103,350, and it is taxed at a rate of 22%. This segment of your income is taxed $11,335.28 at the federal level.
Your total federal income tax for the year would be $16,913,78, or an effective tax rate of 16.9%. While your marginal tax rate is 22%, your effective rate is, as you see, significantly lower than that.
Examples of Calculation Scenarios
When using a net take-home pay calculator, you can determine how much of your gross annual pay is actually deposited into your bank account every pay period. Here’s an example of how it might work:
Scenario 1: An individual is single and earns $100,000 per year. Their effective federal tax rate is 16.9%, and their effective state and local taxes are 5%. FICA tax is a standard 7.65%. Their pretax deductions are $3,000, and their after-tax deductions are $5,000.
Net pay: $75,845
Scenario 2: An individual is married, filing jointly, with an income of $100,000. Their effective federal tax rate is 11.45%, and their effective state and local income taxes are 3%. FICA tax comes to 7.65%. Their pretax deductions are $1,000, and their after-tax deductions are $2,000.
Net pay: $89,018
As you see, even with the same annual income, net pay can look very different, as revealed when using a net pay calculator. Knowing where you stand in terms of your take-home pay can be a valuable tool when tracking your money and avoiding common budgeting mistakes.
Net Pay Tips
Here are a few ways you might optimize your net pay.
• To positively impact your net pay, adjust your tax withholdings on your W-4 form.
• Consider maximizing pretax contributions to retirement accounts like a 401(k) and Flexible Spending Accounts (FSA). This lowers your taxable income and can save you money.
• When possible, sign up for other pretax benefits such as health insurance and commuter benefits.
• Think carefully about how working overtime or a part-time gig could raise your income and push you into a higher tax bracket, increasing your effective tax rate.
Recommended: Using an Online Budget Planner
The Takeaway
Using a net pay calculator can help you quickly and easily understand how much of your annual salary you actually take home. This can inform your salary negotiations, budgeting, benefit choices, and long-term financial planning as you work to manage your money better.
Take control of your finances with SoFi. With our financial insights and credit score monitoring tools, you can view all of your accounts in one convenient dashboard. From there, you can see your various balances, spending breakdowns, and credit score. Plus you can easily set up budgets and discover valuable financial insights—all at no cost.
See exactly how your money comes and goes at a glance.
FAQ
What is the difference between my gross pay and my net pay?
Your gross pay is the total amount you earn, while your net pay is what you take home after taxes, health insurance, retirement contributions, and other key deductions are subtracted.
How does the calculator determine my take-home pay after taxes and deductions?
The net pay calculator can help by doing the math for how much money is subtracted for taxes and other deductions. It shows you your annual take-home pay, which you can then divide by the number of pay periods per year. This reveals how much money you have to work with when spending, saving, and paying down debt.
How do different tax filing statuses and exemptions affect my net pay?
Filing status and exemption information, which you typically provide on your W-4 form, determines how much federal income tax is withheld from each paycheck. This in turn impacts your net pay. If you select a status with lower withholding, your take-home pay will increase, while higher withholding will lower your pay.
Does the calculator account for both federal and state income taxes?
Yes, the net pay calculator has places to account for both federal and state (as well as local) taxes when determining your net pay.
Can I use the calculator to see the impact of overtime pay or a bonus on my paycheck?
Yes, you can use the net pay calculator to play out different scenarios, such as how much overtime or a bonus would alter your take-home pay. (Note that employers are typically obligated to deduct taxes from bonuses, which are considered a form of supplemental pay.)
Is the estimated net pay from the calculator the exact amount I will receive on my paycheck?
Typically, a net pay calculator can provide a very good estimate of your take-home pay, but it is not 100% accurate. That is because a calculator may not account for every single deduction or garnishment of your pay. You can check your paystub for precise, detailed insights.


SoFi Relay offers users the ability to connect both SoFi accounts and external accounts using Plaid, Inc.’s service. When you use the service to connect an account, you authorize SoFi to obtain account information from any external accounts as set forth in SoFi’s Terms of Use. Based on your consent SoFi will also automatically provide some financial data received from the credit bureau for your visibility, without the need of you connecting additional accounts. SoFi assumes no responsibility for the timeliness, accuracy, deletion, non-delivery or failure to store any user data, loss of user data, communications, or personalization settings. You shall confirm the accuracy of Plaid data through sources independent of SoFi. The credit score is a VantageScore® based on TransUnion® (the “Processing Agent”) data.
Financial Tips & Strategies: The tips provided on this website are of a general nature and do not take into account your specific objectives, financial situation, and needs. You should always consider their appropriateness given your own circumstances.
Tax Information: This article provides general background information only and is not intended to serve as legal or tax advice or as a substitute for legal counsel. You should consult your own attorney and/or tax advisor if you have a question requiring legal or tax advice.
External Websites: The information and analysis provided through hyperlinks to third-party websites, while believed to be accurate, cannot be guaranteed by SoFi. Links are provided for informational purposes and should not be viewed as an endorsement.
Third Party Trademarks: Certified Financial Planner Board of Standards Center for Financial Planning, Inc. owns and licenses the certification marks CFP®, CERTIFIED FINANCIAL PLANNER®
SORL-Q325-017


View your free credit score and earn rewards points.
Free Credit Score Checks & Credit Score Tracking
{/* Hero banner */}
Check your free
credit score online
in minutes.
Meeting your financial goals starts with knowing your
credit score. Sign up for a free credit score check to
gain insights into your score and how to improve it.
Get started
Must click on the link to be eligible. Other terms and conditions apply.
Based on SoFi Members. This claim may not be representative of the experience of all other customers.
{/* RTBs with Icons */}
Start building your
credit with insights from SoFi.
Get started
Do a free credit score check in minutes.
Check your credit score at no cost in minutes to help you hit your goals.
Simulate credit scenarios.
Determine how certain financial decisions might impact your score.
Get credit insights.
Understand the factors that drive your credit score and what you can do to influence them.
Protect your data.
Multifactor authentication helps keep your personal data safe and secure.
Get started
{/* what is */}
What is a credit score?
Here’s the gist: A credit score is a three-digit number ranging from 300 to 850 that lenders use to assess the risk involved in lending you money. It’s calculated using information from your credit report, like your payment history, amounts owed, length of credit history, new credit applications, and the types of credit you use. A higher score indicates lower risk and can help you qualify for loans and credit cards with better interest rates and terms.
Learn more
{/* benefits */}
The benefits of checking
your credit score.
Keep an eye on your credit score.
By monitoring your credit with SoFi, you’ll get alerts to potential unauthorized activity or
identity theft—at no cost.
Prepare for major financial decisions.
Your credit score is important when you’re applying for an auto loan, buying a home, or signing up for a new credit card.
Identify areas for improvement.
See how your payment history and other factors impact your credit score and simulate changes to craft a plan for improvement.
{/* how to */}
How to sign up for free credit score monitoring with SoFi.
Sign up in under a minute—with easy setup and no impact to your credit score:†
Get started
{/* Credit Score Bar */}
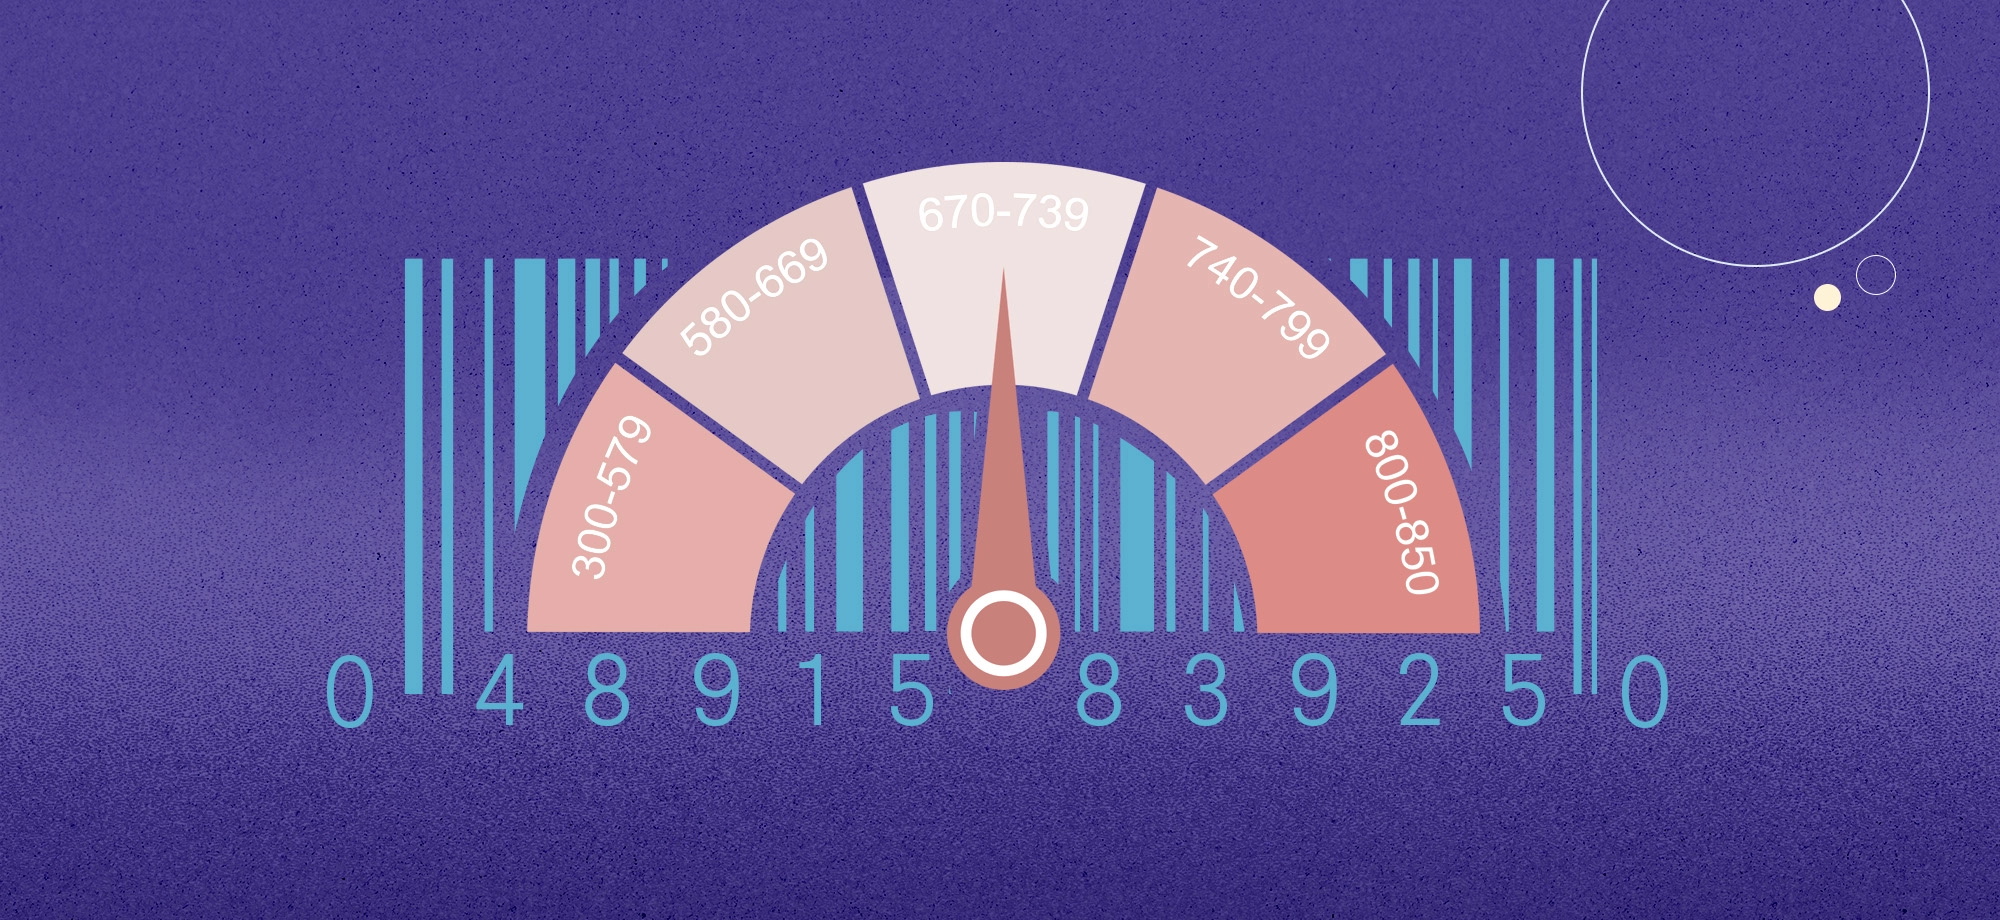
The power of a good credit score.
A good credit score falls in the range of 670–739 on a scale of 300-850. Scores above 740 are considered good while scores of 781 or higher are excellent. High scores are more likely to secure favorable loan terms.
Track your credit growth
See how your credit score has changed over time
Powered by TransUnion®
Get your VantageScore 3.0 credit score updated weekly
Get started
{/* FAQs */}
FAQs
What accounts can I link on SoFi?
You can link a variety of accounts to view your full financial picture. This includes checking and savings accounts, investment and retirement accounts, credit cards, student loans, mortgages, and other liabilities. Linking accounts allows you to see your net worth and track your financial progress all in one place.
Will checking my credit hurt my credit score?
No, checking your own credit
Learn more: Does Checking Your Credit Score Lower Your Rating?
Why does my credit score matter?
Your credit score is a numerical representation of your creditworthiness. Lenders use it to determine the likelihood of you repaying borrowed money. A higher credit score can help you get approved for loans, credit cards, and mortgages, and often leads to lower interest rates and better terms. It can also be used by landlords, employers, and insurance companies.
What is a good credit score?
While the definition of a “good” credit score can vary depending on the score model used by each credit bureau, a VantageScore® 3.0 Score of 661 to 780 is generally considered good. Scores of 781 to 850 are considered “excellent.” A good score increases your chances of getting approved for credit and securing favorable terms.
Learn more: Guide to Credit Score Ranges
What is the difference between a credit report and a credit score?
A credit report is a detailed history of your credit activity, including accounts, payment history, and public records. A credit score is a three-digit number calculated based on the information in your credit report. The report is the data, while the score is the summary of that data that lenders use to assess your risk.
What factors are used to calculate my credit score?
The primary factors used to calculate your credit score include your payment history, the amount of debt you owe (credit utilization), the length of your credit history, the types of credit you use (credit mix), and new credit inquiries. Payment history is the most important factor, as it shows whether you’ve paid past credit accounts on time.
Learn more: What Factors Affect Your Credit Score?
How can a free credit check help me with identity theft?
Regularly checking your free credit report is a key way to spot signs of identity theft. You can review the report for any accounts or inquiries you don’t recognize, which could indicate that someone has opened a fraudulent account in your name. If you find suspicious activity, you can take steps to report it and protect your credit.
What’s the difference between a soft inquiry and a hard inquiry?
A soft inquiry (or “soft pull”) occurs when you check your own credit or when a lender pre-approves you for an offer. It does not affect your credit score. A hard inquiry (or “hard pull”) happens when a lender checks your credit after you formally apply for a new loan or credit card. Hard inquiries can cause a small, temporary drop in your score.
Learn more: What’s the Difference Between a Hard and Soft Credit Check?
Which credit bureau do free credit score services like SoFi use?
SoFi uses TransUnion to provide your credit score and related information. Specifically, it uses the VantageScore 3.0 model. While your free score is an excellent educational tool for monitoring your credit health, it may not perfectly match the score a lender pulls, as different models weigh factors differently.
See more FAQs
{/* Learn More resources articles */}
Learn more about credit scores and
why they’re important.
Learn more
{/* footer */}
See your credit score at no cost.
Checking your credit score with SoFi is quick, easy, and free. Sign up now to see your
credit score in minutes. Just like that.
Get started
Read more
Could Your Shopping Habits Replace Your Credit Score?
This article appeared in SoFi's On the Money newsletter. Not getting it? Sign up here.
You may be familiar with this conundrum, especially if you’re a recent college grad or just venturing out on your own: You need credit to get credit. Lenders want to see your track record as a borrower before approving you for a credit card or car loan. So how do you get started?
The academic world has found an intriguing solution. Building on their previous study of grocery shoppers, professors from the University of Notre Dame, Rice University, and Northwestern University recently determined that shopping habits overall — not just for groceries — say a lot about how likely someone is to pay back their loans.
The new study compared purchase data from a group of people in Peru with their records from the country’s national credit registry. Looking at a broad swath of purchases — including clothing, household goods, and home improvement items — the professors found that people who bought items on sale, shopped at regular times, and consistently avoided cash payments posed a lower default risk than those who didn’t.
In fact, according to these researchers, if lenders used shopping data as part of their vetting process, they could double or even triple credit card approval rates for first-time borrowers without risking a significant increase in unpaid debts.
(The grocery study found a similar correlation with bargain shoppers, and determined that people are more likely to pay their bills on time if they grocery shop on the same days, spend similar amounts, and choose the same products.)
So what? As a growing body of research suggests that lenders use less traditional data sources to decide who to loan to, building healthy financial habits could take on a whole new meaning. Even if you already have a solid track record with credit, it could become more important to cultivate not just responsible borrowing habits, but also prudent spending habits.
And in the meantime, if you’re trying to get a credit card or loan without a credit history, consider getting a secured credit card or becoming an authorized user on a parent’s account first. (Don’t do this, though, if your parents don’t have good credit habits — or if you’re less sure that you will — because it can impact both you and your parent.)
Related Reading
Dear SoFi, How Do I Avoid Messing Up My First Credit Card? (SoFi)
How to Use Rent-Reporting Services to Build Credit (NerdWallet)
Surprising Trends in American Spending Habits You Need to Know (Investopedia)
Please understand that this information provided is general in nature and shouldn’t be construed as a recommendation or solicitation of any products offered by SoFi’s affiliates and subsidiaries. In addition, this information is by no means meant to provide investment or financial advice, nor is it intended to serve as the basis for any investment decision or recommendation to buy or sell any asset. Keep in mind that investing involves risk, and past performance of an asset never guarantees future results or returns. It’s important for investors to consider their specific financial needs, goals, and risk profile before making an investment decision.
The information and analysis provided through hyperlinks to third party websites, while believed to be accurate, cannot be guaranteed by SoFi. These links are provided for informational purposes and should not be viewed as an endorsement. No brands or products mentioned are affiliated with SoFi, nor do they endorse or sponsor this content.
SoFi isn't recommending and is not affiliated with the brands or companies displayed. Brands displayed neither endorse or sponsor this article. Third party trademarks and service marks referenced are property of their respective owners.
OTM20251006SW
Read moreStay up to date on the latest business news and stock market happenings.