
Current Mortgage Refinance Rates in Indiana Today
Apply online or call for a complimentary mortgage consultation.
Compare mortgage refinance rates in Indiana.
Key Points
• Mortgage refinance rates are influenced by a variety of economic factors, including the Federal Reserve’s policies, inflation, and the bond market. Your personal financial profile will also play a role in the rates you are offered.
• In Indiana, refinance rates have shifted dramatically in the last few years, from a low of 3.15% in 2021 to a 7.00% high in 2023.
• A 1.00% drop in your mortgage rate in Indiana could translate to substantial monthly savings — around $2,000 a year on a $300,000 loan.
• Government-backed loans such as FHA and VA may offer you lower mortgage refinance rates and more flexible criteria. These loans are accessible to a broad range of borrowers.
• Closing costs for mortgage loan refinancing usually fall between 2% and 5% of the loan amount. Measure these costs against your potential savings to determine if a mortgage refinance is the right move for you right now.
Introduction to Mortgage Refinance Rates
To start: What is a mortgage refinance? It’s what you do to give your current home loan a makeover. Your new loan may have different terms that can be more favorable than those of your existing mortgage. You also may be able to lower your interest rate.
Homeowners thinking about refinancing can find a lot of different motivations for doing it, in Indiana and elsewhere. Maybe you’re hoping to lower your monthly overhead, or to tap some of your equity for a bathroom renovation. How soon can you refinance a mortgage? It is going to depend on a number of factors.
This guide will help you understand how mortgage refinances work and how to get the best rates in today’s market, focusing on factors that affect Indiana homeowners.
💡 Quick Tip: How soon can you refinance your mortgage? It varies by loan type, but typical waiting periods are 6 to 12 months.
Where Do Refi Interest Rates Come From?
Mortgage refinance rates are influenced by outside economic factors and your personal financial profile. When it comes to economics, the most important variables include Federal Reserve policy, inflation, and housing inventory. The bond market, and especially the performance of the 10-year U.S. Treasury Note, plays a key role in determining current mortgage rates. When the yield on the Treasury Note increases, mortgage interest rates generally rise as well.
In times of high inflation, mortgage rates often climb, but when inflation is in check, you might see interest rates drop. The Fed’s monetary policy and the bond market also play parts in this financial symphony. Knowing more about these factors can help you feel educated to make the best decisions about refinancing your mortgage.
Don’t forget to consider your own financial scenario. Having a strong credit score — which is determined by such factors as your history of on-time payments, your credit utilization ratio, and your credit mix (like, having managed any installment loans and credit lines you hold responsibly) — is a definite asset when you apply for a mortgage refi.
How Interest Rates Affect Home Affordability
Looking to refinance your mortgage? Interest rates in Indiana are sure to play a major role in what you can afford to do. Your monthly payment will be based on the loan amount, the term of the loan, and the interest rate you’re offered. For example:
A $200,000 home loan with a 6.00% interest rate and a 30-year term will require a monthly payment of $1,199. But the exact same loan with an 8.00% interest rate would give you a monthly payment of $1,467.
| Interest Rate | Monthly Payment | Total Interest |
|---|---|---|
| 6.00% | $1,199 | $231,677 |
| 6.50% | $1,264 | $255,085 |
| 7.00% | $1,330 | $279,021 |
| 7.50% | $1,398 | $303,403 |
| 8.00% | $1,467 | $328,309 |
Secure a lower interest rate and you can save tens of thousands of dollars over your loan term, which could seriously impact your financial state. It could also play a role in achieving long-term goals like starting your own business or financing your child’s college tuition.
Why You Should Refinance Your Mortgage in Indiana
Refinancing your mortgage offers a number of benefits, depending on the financial goals you have. If current interest rates are lower than what your existing mortgage has, refinancing can most likely reduce your monthly payments and save you money over the loan’s life. Refinancing can help you switch, too, from an adjustable-rate mortgage to one with a fixed rate for savings in the long run. Another great approach is to refinance a 30-year mortgage to a new 15-year term, which can save you a lot of money in the long run.
Remember that refinancing a mortgage will almost always involve closing costs. A no-closing-cost refinance sounds like a real find, but they are often too good to be true — those charges will probably get rolled into the new mortgage, or you’ll pay a higher interest rate.
Whatever your reason for wanting to do it, you should have 20% equity or more in your home before you push play on a refinance, especially if you want to cash out some of your equity.
Common Reasons to Refinance a Mortgage
These are some of the more common goals of homeowners who refinance their mortgages:
• Qualifying for a lower interest rate thanks to improved credit or market conditions.
• Adjusting the repayment term to make monthly payments more manageable, or to pay off the loan more swiftly.
• Tapping into home equity in order to fund significant expenses, like a home remodel.
• Wanting to switch to a fixed-rate loan, since an adjustable-rate mortgage reset is coming soon.
• Wanting to get mortgage insurance out of your life when you have an FHA loan and 20% equity.
• Considering a debt consolidation, or releasing a cosigner.
Recommended: How Soon Can You Refinace a Mortgage?
How to Get the Best Refi Interest Rate
Your financial history always has an impact on interest rates that lenders offer you in Indiana. Homeowners with strong credit and low debt-to-income ratio may secure lower rates than those with less-ideal profiles.
To secure a competitive mortgage refinance rate, here’s what you should work on:
• Bolster your credit score by paying your bills on time and steering clear of new debt.
• Maintain a debt-to-income ratio under 36%.
• Explore offers from multiple lenders.
• Think about buying mortgage discount points to lower your interest rate.
Once you’ve achieved an optimal credit history, it’s time to deep-dive into rate trends.
Examining Trends in Indiana Mortgage Interest Rates
No one can predict with certainty where rates are headed at any given moment, but by understanding where they’ve been, you’ll be better equipped to make a decision right for you.
Historical U.S. Mortgage Interest Rates
Here’s a longer view of national mortgage rates. You can see that rates in the early 2000s were at around 6.00%. In 2020, they dropped lower, to under 3.00%. This decrease planted the idea in people’s minds that low rates were “normal.” In 2023, however, they rose again. Soon they were hitting around 7.00%.
A lot of people today complain about high interest rates. Current mortgage refinance rates, however, remain below the 50-year average.

Historical Interest Rates in Indiana
Below, compare Indiana and U.S. nationwide rates from 2000 to 2018 — they’re similar but not identical. (The Federal Housing Finance Agency stopped compiling state averages after 2018.)
| Year | Indiana Rate | National Rate |
|---|---|---|
| 2000 | 8.13 | 8.14 |
| 2001 | 7.08 | 7.03 |
| 2002 | 6.67 | 6.62 |
| 2003 | 5.97 | 5.83 |
| 2004 | 5.89 | 5.95 |
| 2005 | 5.97 | 6.00 |
| 2006 | 6.67 | 6.60 |
| 2007 | 6.55 | 6.44 |
| 2008 | 6.14 | 6.09 |
| 2009 | 5.39 | 5.06 |
| 2010 | 5.01 | 4.84 |
| 2011 | 4.97 | 4.66 |
| 2012 | 3.71 | 3.74 |
| 2013 | 4.05 | 3.92 |
| 2014 | 5.24 | 4.24 |
| 2015 | 4.01 | 3.91 |
| 2016 | 3.86 | 3.72 |
| 2017 | 4.19 | 4.03 |
| 2018 | 4.75 | 4.57 |
Choose the Right Mortgage Refi Type
The type of mortgage refinance you choose will influence the interest rate you’re offered. Some refi loans trend higher or lower, and that’s good to keep in mind when considering refinancing options.
Conventional Refi
A conventional mortgage refinance, also known as a rate-and-term refinance, is a popular choice for homeowners who want to enhance their mortgage terms. These refis often carry higher rates than government-backed loans such as FHA, VA, or USDA, but they provide increased flexibility and potential to waive PMI, or private mortgage insurance, if you have at least 20% in home equity. This type of refinance is an excellent option for a homeowner aiming to reduce an interest rate or adjust their loan term. Two types of conventional refis are a 15-year term refi and and adjustable-rate refi:
15-Year Mortgage Refi
Now, let’s talk about a 15-year mortgage refinance. This option can really be a game-changer. It will help you cut down the total interest you’ll pay over the loan’s life, even though you’ll have higher monthly payments.
On a 30-year, $1 million loan at a 7.50% rate, for instance, you’d be looking at a monthly payment of around $6,992 and a whopping $1,517,167 in total interest over the life of the loan. If you refinanced to a 15-year term at a 7.00% rate, you would see your monthly payments rise to about $8,988 — but the total interest would drop to roughly $617,891, saving you close to $900,000 in interest.
Shorter loan terms save you money in a couple of ways: by reducing the time you’re paying interest on the loan, and by offering slightly lower interest rates than loans with longer terms do.
Adjustable-Rate Mortgage Refi
Adjustable-rate mortgages (ARMs) usually start with a lower interest rate than fixed-rate loans, but the rate changes over time. If you plan to move before the rate adjusts, an ARM may be a good option for you. In the short term, you can save on monthly payments and get the financial breathing room to set sights on your next home.
Cash-Out Refi
Cash-out refinances are a popular way to leverage home equity. This type of loan can put a lump sum in your hands that you can use for a range of financial needs, from home improvements to consolidating high-interest debt. Here’s one example: Your home is worth $500,000 and your current mortgage balance is $300,000, so you have $200,000 in equity. A lender may allow you to borrow up to 80% of your equity. In that case, you’d be left with $100,000 after you paid off your existing mortgage. This can be a great approach to tackling debt or financing a big-ticket item.
FHA Refi
FHA loans are insured by the Federal Housing Administration, and often come with lower interest rates, making them attractive for refinancers. If you have an FHA loan already, you can opt for an FHA Simple Refinance or an FHA Streamline Refinance to potentially lower your rate. If you don’t have an FHA loan, options include an FHA cash-out refinance or an FHA 203(k) refinance, which is designed for home renovations and repairs. By choosing one of these alternatives, you can get financial flexibility and possibly lower monthly payments.
VA Refi
VA loans, backed by the Department of Veterans Affairs, are known for offering some of the most competitive interest rates in the mortgage market. If you want to qualify for a VA refinance, also known as an Interest Rate Reduction Refinance Loan (IRRRL), you’ll need to have an existing VA loan. This type of refinance can lower your monthly payments and remove the need for private mortgage insurance for eligible veterans and their families.
Compare Mortgage Refi Interest Rates
To ensure you’re getting the best deal, you’ll want to compare rates from multiple lenders in Indiana. In fact, it’s smart to look beyond interest rates to the annual percentage rate (APR).
APR is a handy equation that incorporates both fees and any discount points you’ve got. Calculate the total loan cost, as well as your break-even point (that is, how long it takes for the money you save to cancel out the out-of-pocket cost of the refinance). Keep an eye on your credit score and your home’s value — the higher they are, the more favorable rates you’ll receive offers for. Don’t forget to peruse local refinance rates for the best deal.
How Can You Get the Best Available Mortgage Refi Interest Rate?
Knowing refinance rates will be crucial for homeowners in Indiana who are looking to secure a competitive mortgage rate. Follow these tips:
• Compare rates from multiple lenders.
• Get prequalified — it can let you see your borrowing power and rates without triggering a hard credit check.
• Compare APRs vs. interest rates, which include interest costs, fees, and discount points.
• Evaluate and crunch the numbers to see if lower rates will trigger higher long-run costs.
• Use a calculator to estimate your savings.
💡 Quick Tip: Wondering how to refinance a mortgage? The process, which takes around 30 to 45 days, is similar to when you got your original home loan.
Online Refinance Calculators
An online refinance calculator can be helpful. It will give you an idea of what your new monthly payment could be, and help you compare different refinance options. These calculators take into account your current loan balance, the interest rate on a potential new loan, and the repayment term, giving you an estimate of how much you could save by refinancing. You can also use it to see how long it would take to recoup your mortgage refinancing costs.
Run the numbers on your home loan.
-

Mortgage calculator
Punch in your home loan amount and a new interest rate, and we’ll estimate your payoff date.
-

Down payment calculator
Enter a few details about your home loan and we’ll provide your monthly mortgage payment.
-

Home affordability calculator
Provide us with a few details and see how much you can afford to spend on a home purchase.
Using the free calculators is for informational purposes only, does not constitute an offer to receive a loan, and will not solicit a loan offer. Any payments shown depend on the accuracy of the information provided.
The Takeaway
Mortgage refinancing is a powerful tool to help you manage your home loan and achieve financial goals. Whether you hope to lower your interest rate, access home equity, or shorten your loan’s term, understanding the different refinance options is key. If you improve your credit score, lower your debt-to-income ratio, and compare offers from multiple lenders, you can secure the best available mortgage refinance rates in Indiana. Just consider the long-term financial implications and make sure that the savings justify the costs involved.
SoFi can help you save money when you refinance your mortgage. Plus, we make sure the process is as stress-free and transparent as possible. SoFi offers competitive fixed rates on a traditional mortgage refinance or cash-out refinance.
A mortgage refinance could be a game changer for your finances.
FAQ
When is mortgage refinancing a smart idea?
When you can lock in a lower interest rate, consolidate your debt, or meet other important financial goals, a mortgage refi might be a good financial decision. Do the math and figure out at what point the cash you’ll save after your refi will exceed the money you’ll spend on the refi itself. How long will you stay in your home? If you’ll end up moving before you’ve recouped the cost of your refi, it won’t make sense.
Can I draw cash out of my house without refinancing?
You can tap into your home’s equity to get money without a refinance. Request a home equity line of credit (HELOC), or take out a home equity loan. These options can all be great ways to pay for home improvements, consolidate debt, or cover other pop-up expenses. Technically, a HELOC or home equity loan is a second mortgage (assuming you still have your first one). It’s important to find the most competitive interest rate during the application process.
Is it possible to lower my interest rate without refinancing?
It’s hard to lower a mortgage interest rate without a refinance. You can reduce your monthly payment, though, by doing a mortgage recast. This move involves making a lump-sum payment toward your principal balance. Your lender can then “recast” your monthly payment amount. If you are facing financial hardship, you can also ask your lender about a loan modification. But lenders tend to suggest a refi or a recast first.
Are refinance rates going to drop anytime soon?
There’s no crystal ball that predicts future mortgage rates, but look at key indicators and you may get a sense of where rates might be headed. If the 10-year Treasury Note rate is rising, the housing market is hot, or the economy is generally strong, it’s unlikely that you will see rates falling in the near future. Keep an eye on the current refinance rates in Indiana so you’ll know when the time is right to refinance.
SoFi Mortgages
Terms, conditions, and state restrictions apply. Not all products are available in all states. See SoFi.com/eligibility-criteria for more information.
SoFi Loan Products
SoFi loans are originated by SoFi Bank, N.A., NMLS #696891 (Member FDIC). For additional product-specific legal and licensing information, see SoFi.com/legal. Equal Housing Lender.
*SoFi requires Private Mortgage Insurance (PMI) for conforming home loans with a loan-to-value (LTV) ratio greater than 80%. As little as 3% down payments are for qualifying first-time homebuyers only. 5% minimum applies to other borrowers. Other loan types may require different fees or insurance (e.g., VA funding fee, FHA Mortgage Insurance Premiums, etc.). Loan requirements may vary depending on your down payment amount, and minimum down payment varies by loan type.
¹FHA loans are subject to unique terms and conditions established by FHA and SoFi. Ask your SoFi loan officer for details about eligibility, documentation, and other requirements. FHA loans require an Upfront Mortgage Insurance Premium (UFMIP), which may be financed or paid at closing, in addition to monthly Mortgage Insurance Premiums (MIP). Maximum loan amounts vary by county. The minimum FHA mortgage down payment is 3.5% for those who qualify financially for a primary purchase. SoFi is not affiliated with any government agency.
†Veterans, Service members, and members of the National Guard or Reserve may be eligible for a loan guaranteed by the U.S. Department of Veterans Affairs. VA loans are subject to unique terms and conditions established by VA and SoFi. Ask your SoFi loan officer for details about eligibility, documentation, and other requirements. VA loans typically require a one-time funding fee except as may be exempted by VA guidelines. The fee may be financed or paid at closing. The amount of the fee depends on the type of loan, the total amount of the loan, and, depending on loan type, prior use of VA eligibility and down payment amount. The VA funding fee is typically non-refundable. SoFi is not affiliated with any government agency.
Non affiliation: SoFi isn’t affiliated with any of the companies highlighted in this article.
Disclaimer: Many factors affect your credit scores and the interest rates you may receive. SoFi is not a Credit Repair Organization as defined under federal or state law, including the Credit Repair Organizations Act. SoFi does not provide “credit repair” services or advice or assistance regarding “rebuilding” or “improving” your credit record, credit history, or credit rating. For details, see the FTC’s website .
Financial Tips & Strategies: The tips provided on this website are of a general nature and do not take into account your specific objectives, financial situation, and needs. You should always consider their appropriateness given your own circumstances.
Qualifying for the reward requires using a real estate agent that participates in HomeStory’s broker to broker agreement to complete the real estate buy and/or sell transaction. You retain the right to negotiate buyer and or seller representation agreements. Upon successful close of the transaction, the Real Estate Agent pays a fee to HomeStory Real Estate Services. All Agents have been independently vetted by HomeStory to meet performance expectations required to participate in the program. If you are currently working with a REALTOR®, please disregard this notice. It is not our intention to solicit the offerings of other REALTORS®. A reward is not available where prohibited by state law, including Alaska, Iowa, Louisiana and Missouri. A reduced agent commission may be available for sellers in lieu of the reward in Mississippi, New Jersey, Oklahoma, and Oregon and should be discussed with the agent upon enrollment. No reward will be available for buyers in Mississippi, Oklahoma, and Oregon. A commission credit may be available for buyers in lieu of the reward in New Jersey and must be discussed with the agent upon enrollment and included in a Buyer Agency Agreement with Rebate Provision. Rewards in Kansas and Tennessee are required to be delivered by gift card.
HomeStory will issue the reward using the payment option you select and will be sent to the client enrolled in the program within 45 days of HomeStory Real Estate Services receipt of settlement statements and any other documentation reasonably required to calculate the applicable reward amount. Real estate agent fees and commissions still apply. Short sale transactions do not qualify for the reward. Depending on state regulations highlighted above, reward amount is based on sale price of the home purchased and/or sold and cannot exceed $9,500 per buy or sell transaction. Employer-sponsored relocations may preclude participation in the reward program offering. SoFi is not responsible for the reward.
SoFi Bank, N.A. (NMLS #696891) does not perform any activity that is or could be construed as unlicensed real estate activity, and SoFi is not licensed as a real estate broker. Agents of SoFi are not authorized to perform real estate activity.
If your property is currently listed with a REALTOR®, please disregard this notice. It is not our intention to solicit the offerings of other REALTORS®.
Reward is valid for 18 months from date of enrollment. After 18 months, you must re-enroll to be eligible for a reward.
SoFi loans subject to credit approval. Offer subject to change or cancellation without notice.
The trademarks, logos and names of other companies, products and services are the property of their respective owners.
SOHL-Q125-169


More refinance resources.
-
How Much Does It Cost to Refinance a Mortgage?
-
How to Refinance a Home Mortgage Loan
-
7 Signs It’s Time for a Mortgage Refinance
Apply online or call for a complimentary mortgage consultation.
Current Mortgage Refinance Rates in Hawaii Today
Apply online or call for a complimentary mortgage consultation.
Compare mortgage refinance rates in Hawaii.
Key Points
• Mortgage refinancing can be a smart move to save money by lowering your interest rate or changing your loan term, but it’s important to consider the costs and benefits.
• Mortgage refinance rates in Hawaii are influenced by economic factors like Federal Reserve policy and inflation, but your finances (such as your credit score) matter, too.
• Even a 1% drop in the rate for a $300,000 mortgage could mean roughly $170 more in your pocket each month.
• Hawaii refinance rates can differ by loan type, with FHA and VA loans often offering lower rates compared to conventional loans, making them attractive options for eligible borrowers.
• Ever thought about switching to a 15-year mortgage? It could be a smart move, as it often means paying less interest over time, even if your monthly payments go up.
• Remember, refinancing is a financial strategy that should be approached thoughtfully. Consider the costs vs. the potential savings, and explore alternatives such as a HELOC if it fits your needs.
Introduction to Mortgage Refinance Rates
Mortgage refinancing is like hitting the reset button on your home loan. You’re swapping your current mortgage for a new one, and if you play your cards right, you could snag a better deal — think lower monthly payments or a more favorable interest rate.
This guide is your ticket to understanding how refi rates are determined and how to score the best one out there. Whether you’re in Hawaii or any other state, getting a handle on what’s driving the current mortgage rates will put you in the driver’s seat.
💡 Quick Tip: Wondering how to refinance a mortgage? The process, which takes about 30 to 45 days, is similar to when you got your original home loan.
Where Do Mortgage Refi Interest Rates Come From?
Mortgage refinance interest rates are a product of both the economic landscape and your unique financial standing.
Economic factors like Federal Reserve policies, inflation, the bond market, and housing inventory all play a part in the cost of home loans. For instance, high inflation and federal funds rate hikes usually translate to higher mortgage rates. On the flip side, low inflation and a robust bond market can work in your favor. By keeping an eye on these moving parts, you can better predict when the time is right for your refinance. Understanding the local climate for mortgage refinance rates in Hawaii is key to making a savvy move.
Also know that your own personal financial profile will impact your access to refinancing options. Those with higher scores will likely qualify for more favorable interest rates, while those with lower scores will appear less creditworthy to lenders and therefore typically be assessed loftier rates.
How Interest Rates Affect Home Affordability
Interest rates play a significant role in the affordability of your refinance payment. Here’s a closer look: The amount you owe, the time to repay (aka the term of your loan), and the interest rate all come together to determine your monthly payment.
For instance, with a $200,000 loan, a 6.00% interest rate, and a 30-year term, you’re looking at $1,199 a month. But bump that interest rate to 8.00%, and suddenly, you’re paying $1,467 monthly. Over the life of the loan, a lower interest rate could save you close to $100,000. Even a small difference in Hawaii refinance rates can lead to substantial savings.
Also, on the topic on interest rates, it’s smart to focus on the annual percentage rate (APR), because that reflects what you actually pay, including additional fees and charges, to borrow money. The APR can give you a more accurate picture of what you will be spending every month and over the life of the loan.
Why Refinance in Hawaii?
Homeowners refinance for a variety of reasons, each influencing the type of refinance and the interest rate. Here’s a closer look at some specifics, but first, a note. In terms of how soon you can refinance, you can’t necessarily swap out your home loan right away if rates drop. You should have at least 20% equity in your home, especially if you plan to cash out some equity.
Common Reasons to Refinance a Mortgage
Homeowners refinance mortgages for key reasons:
• Lower rates can mean reduced monthly payments and less interest.
• Adjusting your repayment term can help you better manage payments or pay off your loan sooner.
• Refinancing can be a path to accessing home equity for large expenses.
• Switching from an adjustable to a fixed rate may provide financial peace of mind.
• You may be able to eliminate FHA mortgage insurance premiums by refinancing once you have 20% equity.
💡 Quick Tip: Some lenders offer a so-called no-closing-cost refinance. However, that usually means either rolling the closing costs into the new mortgage principal or exchanging them for a higher interest rate.
How to Get the Best Available Mortgage Refi Interest Rate
If refinancing seems like a wise move, follow this advice to secure the best mortgage refinance rate:
• Build your credit score by paying bills promptly (this is the single biggest factor in determining your score) and sidestepping new debt to keep your credit utilization ratio down.
• Keep your debt-to-income ratio under 36%.
• Compare rates and fees from multiple lenders, including your current financial institution if they offer home loans. You might get a favorable rate since you’re already a client.
• Think about buying discount points (often called mortgage points) to lower your interest rate. Although that means putting down more cash upfront, it can lower your monthly payment and the total overall interest you pay.
• Choose the shortest refi term you can manage to minimize the amount of interest you pay over the life of the loan.
These steps can help you optimize your financial strategy and take advantage of the best Hawaii refinance rates available. Worth noting: While the interest rate is important, make sure you stay tuned into the other fees and costs associated with refinancing. Just as with a primary home loan, mortgage refinancing costs usually involve closing costs to the tune of 2% to 6% of the loan amount.
Understand Trends in Hawaii Mortgage Interest Rates
National mortgage rates have been on a bit of a rollercoaster in recent years, as you will learn about in a moment. The rates in Hawaii tend to mirror these fluctuations. What often makes Hawaii a special case in terms of mortgages isn’t the interest rate on loans, but the fact that Hawaii ranks as one of the most expensive states in the U.S. in terms of property values, with a current median of approximately $947,000. Such elevated prices can push many borrowers into the realm of jumbo loans.
That said, if you’re a homeowner in Hawaii, interest rate trends are something to keep in mind if you’re considering refinancing. Here’s some more detailed intel to consider.
Historical U.S. Mortgage Interest Rates
Mortgage interest rates have seen their share of ups and downs, mirroring the ebb and flow of the economy. In 2021, the average 30-year fixed rate was a modest 3.15%. Fast forward to 2023, and we saw a significant jump to 7.00%. Federal Reserve actions, inflation, and the bond market all play a part in these changes. Moving into early 2025, it’s looking like rates will remain higher for longer, though many had hoped the Fed might cut rates by now.
Below is a graph that gives you an overview of how mortgage rates have varied over the last few decades. By familiarizing yourself with these past trends, you may be better equipped to understand these fluctuations, make decisions about your mortgage, and potentially save money by refinancing when rates are low.
Historical Interest Rates in Hawaii
Hawaii refinance rates tend to follow the national trends, but there can be some differences. Here is a chart summarizing almost two decades’ worth of rates, both in Hawaii and in the U.S. overall, for mortgages. This can provide a closer look at how Hawaii rates typically track; as you’ll see, they are usually slightly lower than the national numbers. (Note that the Federal Housing Finance Agency stopped tracking these numbers in 2018, so the chart ends with that year.)
| Year | Hawaii Rate | National Rate |
|---|---|---|
| 2000 | 7.59 | 8.14 |
| 2001 | 6.81 | 7.03 |
| 2002 | 6.44 | 6.62 |
| 2003 | 5.43 | 5.83 |
| 2004 | 5.40 | 5.95 |
| 2005 | 5.73 | 6.00 |
| 2006 | 6.15 | 6.60 |
| 2007 | 6.01 | 6.44 |
| 2008 | 5.73 | 6.09 |
| 2009 | 4.79 | 5.06 |
| 2010 | 4.83 | 4.84 |
| 2011 | 4.58 | 4.66 |
| 2012 | 3.68 | 3.74 |
| 2013 | 3.80 | 3.92 |
| 2014 | 4.16 | 4.24 |
| 2015 | 3.88 | 3.91 |
| 2016 | 3.73 | 3.72 |
| 2017 | 3.99 | 4.03 |
| 2018 | 4.48 | 4.57 |
Choose the Right Mortgage Refi Type
Next, review the mortgage refinance types that may be available to you. Which one is right for you? That will depend on your financial situation and goals. Do you need to lower your monthly bills ASAP, or is your goal to free up some cash from your home equity, or perhaps shorten your loan term? The answer can play an important role in your choice.
Conventional Refi
A conventional refinance, also known as a rate-and-term refi, involves changing the interest rate or loan term of your mortgage. Conventional refis typically come with higher rates than government-backed loans (FHA, VA, USDA), though those loans have specific qualification requirements.
Conventional refinance loans can be suitable for homeowners who want to lower their interest rate or change their repayment term. To get approved, you generally need a minimum credit score (often 620 or higher), sufficient home equity (typically 20%), and a manageable debt-to-income ratio.
Cash-Out Refi
Cash-out refinances offer a way to tap into your home’s equity and get a new mortgage for more than you currently owe. You can then take the difference in cash. Cash-out refis typically have higher interest rates than traditional refis, but they can be a smart way to get a large sum of money for things like home renovations or paying off high-interest debt. For example, if you have a $500,000 home and a $300,000 mortgage, you have $200,000 in equity, and can typically access up to 80% of that amount.
15-Year Mortgage Refi
Switching from a 30-year to a 15-year mortgage by refinancing could help you pay off your debt that much sooner and save big on interest. Sure, the monthly payments are higher, but the long-term savings are impressive.
Here’s an example:
• A 30-year, $1 million loan at 7.50% APR results in a monthly payment of about $6,992 and a total interest of $1,517,167.
• If you refinanced to a 15-year term at 7.00%, your monthly payment jumps to around $8,988. But the total interest paid plummets to approximately $617,891, saving you nearly $900,000.
When you’re weighing your options for mortgage refinance rates in Hawaii, consider the substantial benefits a 15-year refi can bring.
Adjustable-Rate Mortgage Refi
An adjustable-rate mortgage (ARM) can start with a lower interest rate than a fixed-rate loan, but it’s essential to consider that the rate may increase over time based on market conditions. If you’re planning to move before the rate adjusts, an ARM could be a smart financial move. For example, if you have a 30-year fixed-rate mortgage but anticipate leaving your home within a few years, an ARM could lower your monthly payments and save you money in the short term.
One note of caution: When considering an ARM refi, it’s important to monitor mortgage refinance rates in Hawaii and assess your future plans. You want to make sure that, if you wind up not moving when anticipated, you can afford the higher payments that might be due.
FHA Refi
FHA loans, backed by the Federal Housing Administration, are often associated with lower interest rates, sometimes a full percentage point less than conventional loans. Some FHA refinance options are tailored exclusively for existing FHA loan holders, such as the FHA Simple and Streamline Refinances.
However, alternatives like the FHA cash-out refinance or the FHA 203(k) refinance are designed for home improvements and are available to those without an FHA loan. These options can still provide you with competitive mortgage refinance rates in Hawaii and the flexibility to manage your home equity.
VA Refi
VA loans, backed by the U.S. Department of Veterans Affairs, are known for their low interest rates. To qualify for a VA refinance, technically called an interest rate reduction refinance loan (IRRRL), you must already have a VA loan. (These are available to past and present members of the military, as well as some spouses.) This type of refinance can help you secure a lower rate and reduce your monthly payments, making it a valuable option for veterans and eligible borrowers.
Compare Mortgage Refi Interest Rates
To snag the best possible mortgage refinance rate for your situation, follow this advice:
• Compare offers from multiple lenders. It can be smart to get at least a few and see how rates and terms stack up.
• Look at the annual percentage rate (APR), which encompasses interest rates, fees, and discount points.
• Evaluate the total costs, including closing costs and fees. Really zero in on how much you will need upfront and then how much you will be paying every month.
• If possible, build your credit score which can allow you to qualify for more favorable rates and terms.
• Stay informed about market trends to time your refinance effectively. Plenty of websites offer regularly updated numbers.
• Ensure your refinance aligns with your financial goals, whether it’s lowering your rate, changing your term, or accessing equity. Hawaii refinance rates should be a key factor in your decision, but pick the refi loan that will get you where you want to go in terms of, say, raising cash to start a business or lowering your monthlies so you can afford your new baby’s daycare costs.
Use an Online Refinance Calculator
Online refinance calculators can be a fantastic resource for getting a ballpark figure of what your new monthly payments might look like and for comparing different refinance options. These calculators take into account your current loan balance, the new interest rate, and the term of the loan. By inputting your specific details, you can get a clear picture of your potential savings and the impact of refinancing. For example, you can use a refinance calculator to see how much you could save by refinancing at the current mortgage refinance rates in Hawaii. Using these tools can help make the decision-making process easier and more informed.
Run the numbers on your home loan.
-
Mortgage calculator
Punch in your home loan amount and a new interest rate, and we’ll estimate your payoff date.
-
Down payment calculator
Enter a few details about your home loan and we’ll provide your monthly mortgage payment.
-
Home affordability calculator
Provide us with a few details and see how much you can afford to spend on a home purchase.
Using the free calculators is for informational purposes only, does not constitute an offer to receive a loan, and will not solicit a loan offer. Any payments shown depend on the accuracy of the information provided.
The Takeaway
Refinancing your mortgage in Hawaii could be a smart financial move that saves you money or helps you achieve other financial goals. By refinancing, you might be able to snag a lower interest rate, reduce your monthly payment, pay off your loan sooner, or tap into your home equity. But refinancing isn’t free — you’ll need to pay closing costs, and keep an eye on those all-important interest rates to gauge how much you’ll be paying. It’s usually smart to compare offers from a few lenders to find the right fit.
SoFi can help you save money when you refinance your mortgage. Plus, we make sure the process is as stress-free and transparent as possible. SoFi offers competitive fixed rates on a traditional mortgage refinance or cash-out refinance.
A mortgage refinance could be a game changer for your finances.
FAQ
Can I lower my interest rate without refinancing?
Yes, you can lower your interest rate without refinancing by recasting your mortgage. This means you pay a lump sum toward your loan principal, and your lender recalculates and lowers your payments. Another option: If you’re facing financial hardship, you can request a loan modification to change your rate and avoid foreclosure.
Is there a cost to recast your mortgage?
When considering a mortgage recast, it’s smart to factor in any associated fees, although they are typically much more modest compared to refinance fees. Lenders usually charge a fee ranging from $150 to $500 for a mortgage recast, but the exact amount may vary, compared with refi closing costs of 2% to 6% of the loan amount. However, It’s crucial to carefully review the terms and conditions set by the lender before proceeding with a mortgage recast to ensure that it aligns with your financial goals and circumstances.
Can I tap into my home’s equity without refinancing?
Yes, you can pull equity out of your home without refinancing through a home equity loan (for a lump sum against your equity) or a home equity line of credit (HELOC). A HELOC allows you to borrow funds as needed, typically with a variable interest rate, up to a set limit. These sources of funds can help homeowners who want to use the equity in their home for things like home improvements, debt consolidation, or paying for college.
SoFi Mortgages
Terms, conditions, and state restrictions apply. Not all products are available in all states. See SoFi.com/eligibility-criteria for more information.
SoFi Loan Products
SoFi loans are originated by SoFi Bank, N.A., NMLS #696891 (Member FDIC). For additional product-specific legal and licensing information, see SoFi.com/legal. Equal Housing Lender.
*SoFi requires Private Mortgage Insurance (PMI) for conforming home loans with a loan-to-value (LTV) ratio greater than 80%. As little as 3% down payments are for qualifying first-time homebuyers only. 5% minimum applies to other borrowers. Other loan types may require different fees or insurance (e.g., VA funding fee, FHA Mortgage Insurance Premiums, etc.). Loan requirements may vary depending on your down payment amount, and minimum down payment varies by loan type.
¹FHA loans are subject to unique terms and conditions established by FHA and SoFi. Ask your SoFi loan officer for details about eligibility, documentation, and other requirements. FHA loans require an Upfront Mortgage Insurance Premium (UFMIP), which may be financed or paid at closing, in addition to monthly Mortgage Insurance Premiums (MIP). Maximum loan amounts vary by county. The minimum FHA mortgage down payment is 3.5% for those who qualify financially for a primary purchase. SoFi is not affiliated with any government agency.
†Veterans, Service members, and members of the National Guard or Reserve may be eligible for a loan guaranteed by the U.S. Department of Veterans Affairs. VA loans are subject to unique terms and conditions established by VA and SoFi. Ask your SoFi loan officer for details about eligibility, documentation, and other requirements. VA loans typically require a one-time funding fee except as may be exempted by VA guidelines. The fee may be financed or paid at closing. The amount of the fee depends on the type of loan, the total amount of the loan, and, depending on loan type, prior use of VA eligibility and down payment amount. The VA funding fee is typically non-refundable. SoFi is not affiliated with any government agency.
Non affiliation: SoFi isn’t affiliated with any of the companies highlighted in this article.
Disclaimer: Many factors affect your credit scores and the interest rates you may receive. SoFi is not a Credit Repair Organization as defined under federal or state law, including the Credit Repair Organizations Act. SoFi does not provide “credit repair” services or advice or assistance regarding “rebuilding” or “improving” your credit record, credit history, or credit rating. For details, see the FTC’s website .
Financial Tips & Strategies: The tips provided on this website are of a general nature and do not take into account your specific objectives, financial situation, and needs. You should always consider their appropriateness given your own circumstances.
Qualifying for the reward requires using a real estate agent that participates in HomeStory’s broker to broker agreement to complete the real estate buy and/or sell transaction. You retain the right to negotiate buyer and or seller representation agreements. Upon successful close of the transaction, the Real Estate Agent pays a fee to HomeStory Real Estate Services. All Agents have been independently vetted by HomeStory to meet performance expectations required to participate in the program. If you are currently working with a REALTOR®, please disregard this notice. It is not our intention to solicit the offerings of other REALTORS®. A reward is not available where prohibited by state law, including Alaska, Iowa, Louisiana and Missouri. A reduced agent commission may be available for sellers in lieu of the reward in Mississippi, New Jersey, Oklahoma, and Oregon and should be discussed with the agent upon enrollment. No reward will be available for buyers in Mississippi, Oklahoma, and Oregon. A commission credit may be available for buyers in lieu of the reward in New Jersey and must be discussed with the agent upon enrollment and included in a Buyer Agency Agreement with Rebate Provision. Rewards in Kansas and Tennessee are required to be delivered by gift card.
HomeStory will issue the reward using the payment option you select and will be sent to the client enrolled in the program within 45 days of HomeStory Real Estate Services receipt of settlement statements and any other documentation reasonably required to calculate the applicable reward amount. Real estate agent fees and commissions still apply. Short sale transactions do not qualify for the reward. Depending on state regulations highlighted above, reward amount is based on sale price of the home purchased and/or sold and cannot exceed $9,500 per buy or sell transaction. Employer-sponsored relocations may preclude participation in the reward program offering. SoFi is not responsible for the reward.
SoFi Bank, N.A. (NMLS #696891) does not perform any activity that is or could be construed as unlicensed real estate activity, and SoFi is not licensed as a real estate broker. Agents of SoFi are not authorized to perform real estate activity.
If your property is currently listed with a REALTOR®, please disregard this notice. It is not our intention to solicit the offerings of other REALTORS®.
Reward is valid for 18 months from date of enrollment. After 18 months, you must re-enroll to be eligible for a reward.
SoFi loans subject to credit approval. Offer subject to change or cancellation without notice.
The trademarks, logos and names of other companies, products and services are the property of their respective owners.
SOHL-Q125-166


More refinance resources.
-
How Much Does It Cost to Refinance a Mortgage?
-
How to Refinance a Home Mortgage Loan
-
7 Signs It’s Time for a Mortgage Refinance
Apply online or call for a complimentary mortgage consultation.
Current Mortgage Refinance Rates in Connecticut Today
CONNECTICUT MORTGAGE REFINANCE RATES TODAY
Current mortgage refinance rates in
Connecticut.
Apply online or call for a complimentary mortgage consultation.
Compare mortgage refinance rates in Connecticut.
Key Points
• Mortgage refinance rates are influenced by many factors, including your credit history — as well as Federal Reserve policy, inflation, and the bond market.
• Connecticut refinance rates have seen their share of ups and downs, ranging from 3.15% in 2021 to 6.89% in 2025, similar to rates nationwide.
• A 1% drop in your mortgage interest rate can lead to significant monthly savings, and may be worth considering.
• Consider the benefits of a 15-year mortgage, which can save you a substantial amount in interest over the life of the loan, despite the higher monthly payments.
• VA refinances, supported by the U.S. Department of Veterans Affairs, offer some of the most competitive mortgage refinance rates in Connecticut, but they come with specific eligibility criteria.
• When considering a refi, remember to account for closing costs: typically between 2% and 5% of the loan amount.
Introduction to Mortgage Refinance Rates
Refinancing your mortgage is almost like getting a clean slate. You take out a new loan to replace your current one, with new terms and a new interest rate.
Whether you want to reduce your monthly payment, pay off your loan faster, or withdraw some of your home equity as cash (called a cash-out refinance), the type of refinancing you choose will play a big role in the rate you get.
This guide will help you understand how refinance rates are set in general — and how you can get the lowest rate possible for a refi in Connecticut. This can help you decide if a refinance is right for you, and start the application process.
💡 Quick Tip: Some lenders offer a so-called no-closing-cost refinance. However, that usually means either rolling the closing costs into the new mortgage principal or exchanging them for a higher interest rate.
Where Do Mortgage Refi Interest Rates Come From?
Current mortgae ratesare the result of a complex interplay of economic factors and your personal financial situation. Key economic factors include:
• Federal Reserve policy
• Inflation
• The bond market
• Housing inventory levels
In general, higher inflation and more aggressive rate hikes lead to higher mortgage rates. Conversely, periods of low inflation and bond market rallies can lead to lower rates. Homeowners should keep an eye on these factors to get a sense of where rates are headed.
Understanding how these factors may influence Connecticut refinance rates can help you make smarter choices about your own refinancing choices, and decide when the time is right for you to refinance your home loan.
How Interest Rates Affect Home Affordability
As you know, interest rates play a big role in making your refinance payment affordable. Your monthly payment is a product of your loan amount, the time you have to repay it, and the interest rate, in addition to mortgage refinancing costs.
For instance, with a $300,000 loan, a 6.00% interest rate, and a 30-year term, you’re looking at a $1,799 monthly payment. But bump that interest rate to 7.00%, and suddenly you’re paying $1,996 — about $200 more per month.
Over the life of the loan, having a lower interest rate could save you close to $70,000. So keep an eye on Connecticut refinance rates to make sure you’re getting the best deal.
| Interest Rate | Loan Term | Monthly Payment | Total Interest |
|---|---|---|---|
| 6.00% | 30-year | $1,799 | $347,515 |
| 6.00% | 15-year | $2,532 | $155,683 |
| 7.00% | 30-year | $1,996 | $418,527 |
| 7.00% | 15-year | $2,697 | $185,367 |
Why Refi?
A mortgage refinance can be a strategic move that can support a range of financial needs and goals.
Picture this: If the current interest rates are playing in your favor, you could be looking at lower monthly payments and long-term savings. It’s a smart move to have at least 20% equity in your home before you take the leap, especially if you’re eyeing the opportunity to cash out some equity.
You may want to consider how soon can you refinance a mortgage, because you want enough of a difference between your current rate and the new rate to make it worthwhile.
Another factor: If you’re tired of the unpredictability of an adjustable-rate loan, switching to a fixed-rate one could provide just the stability you’re after. You just want to be sure to compare different Connecticut refinance rates to land the best deal.
Common Reasons to Refinance a Mortgage
Here are common reasons homeowners refinance:
• Rates are more attractive due to the homeowner’s improved credit, or simply owing to market changes.
• Homeowners may wish to either ease monthly payments or pay off their loan faster.
• They plan to cash out home equity for their financial goals.
• There’s a desire to switch from an adjustable-rate mortgage to a fixed rate.
• It’s possible to ditch mortgage insurance once the homeowner has 20% equity.
• They want to roll high-interest debt into a lower-rate mortgage.
How to Get the Best Available Interest Rate
Securing a competitive mortgage refinance rate is crucial, and there are various levers you can pull to ensure the best rate. Here’s how to refinance your mortgage effectively:
• Boost your credit score by making on-time payments and avoiding new debt.
• Keep your debt-to-income ratio under 36%.
• Shop around and compare rates and fees from multiple lenders.
• Think about purchasing mortgage points to reduce your interest rate.
• Choose a shorter loan term, like 10 or 15 years, for potentially lower rates (although your payment will likely be higher; you’ll still pay less over time).
Next step is to keep an eye on Connecticut mortgage interest rate trends. Here’s how.
Trends in Connecticut Mortgage Interest Rates
Connecticut’s mortgage rates have been on a wild ride in recent years, along with most other states. The average 30-year fixed mortgage rate in the U.S. was 3.15% in 2021, but it jumped to nearly 7.80% in 2023. Rates then went back on a rollercoaster for most of 2024, fluctuating between about 7.22% earlier in the year, dipping down to about 6.0% that summer, and ending the year closer to 6.90%.
Fortunately, 2025 shows some moderation. But while experts predicted rates might continue to trend lower, the March 2025 meeting of the Federal Reserve suggests that rates will stay more or less where they are for the year: about 6.68%. That could change if there is a shift in policy or another significant event. So it’s best to keep an eye on current mortgage refinance rates before deciding if and when to refinance.
Historical U.S. Mortgage Interest Rates
Mortgage interest rates in the United States have seen their fair share of ups and downs over the years, as many home buyers and home refinancers know.
As noted, back in 2021 the average 30-year fixed rate was a mere 3.15%, giving homeowners a golden opportunity to lock in some very attractive terms. By late 2022, though, that 30-year average rate had surged — rising close to 7.80% toward the end of 2023.
Thankfully, rates moderated in 2024 — although there was still some volatility — with the average 30-year fixed rate hovering at 6.65%, as of March 27, 2025.
Historical Interest Rates in Connecticut
For the most part, Connecticut refinance rates have followed the same patterns as refinance rates in the rest of the country. When national rates are low, Connecticut rates trend lower. When national rates are high, Connecticut rates also move higher.
As noted, rates have been on a rollercoaster ride in the last few years, but may be leveling off for the rest of 2025 — something to keep in mind, as you weigh your refi.
| Year | Connecticut Rate | National Rate |
|---|---|---|
| 2000 | 7.96 | 8.14 |
| 2001 | 7.06 | 7.03 |
| 2002 | 6.51 | 6.62 |
| 2003 | 5.72 | 5.83 |
| 2004 | 5.67 | 5.95 |
| 2005 | 5.77 | 6.00 |
| 2006 | 6.44 | 6.60 |
| 2007 | 6.42 | 6.44 |
| 2008 | 6.09 | 6.09 |
| 2009 | 4.99 | 5.06 |
| 2010 | 4.92 | 4.84 |
| 2011 | 4.60 | 4.66 |
| 2012 | 3.67 | 3.74 |
| 2013 | 3.84 | 3.92 |
| 2014 | 4.19 | 4.24 |
| 2015 | 3.90 | 3.91 |
| 2016 | 3.69 | 3.72 |
| 2017 | 3.92 | 4.03 |
| 2018 | 4.57 | 4.57 |
Choose the Right Mortgage Refi Type
Here’s another thing to keep in mind: Mortgage refinancing rates vary by the type of refinancing you’re considering. Let’s take a closer look.
Conventional Refi
A conventional refinance, also known as a rate-and-term refi, is like hitting the reset button on your mortgage. You replace your current loan with a new one, ideally scoring a lower interest rate or adjusting the term.
While these refis generally come with higher rates than government-backed loans such as FHA, VA, or USDA loans, they can also offer more flexibility and fewer restrictions. To qualify, a good credit score and at least 20% equity in your home are typically required. Be sure to compare Connecticut refinance rates for conventional loans to snag the best deal.
Two examples of a conventional mortgage refi are a 15-year term refi and an adjustable-rate refi.
15-Year Refi
Opting for a 15-year mortgage refinance could be a game-changer, slashing your total interest payments, even if the monthly installments are a bit steeper.
Let’s say you have a 30-year, $500,000 loan at 6.80% interest, which translates to roughly $3,259 per month and total interest paid of $673,462.
By switching to a 15-year term at 5.80%, your monthly payment would climb to about $4,189, but the total interest would plummet to approximately $249,780, saving you over $400,000.
Adjustable-Rate Refi
Adjustable-rate mortgages (ARMs) often kick off with a lower interest rate than fixed-rate loans, which might be just the ticket if you’re planning to refinance (or sell your home) before the rate adjusts. You just have to understand the terms, when and how often the mortgage rate adjusts, and what you can afford.
For instance, if you currently have a 30-year fixed-rate mortgage, but are considering a move within a handful of years, switching to an ARM could translate to lower monthly payments. However, it’s essential to keep in mind that rates have the potential to rise at any point, which could mean your monthly payments would likewise increase.
Cash-Out Refinancing
With a cash-out refinance, you can leverage your home equity to receive a lump sum, which can help you fund various goals, from home improvements to debt management.
For example, if your home is valued at $500,000 and you owe $300,000 on your current mortgage, that gives you about $200,000 in equity. A lender might offer you up to 80% of your equity, which could mean an additional $100,000 in your pocket after settling your existing mortgage. Depending on the current refinance rates in Connecticut, this could be a good deal.
FHA Loan Refi
FHA refinances, insured by the Federal Housing Administration, often offer lower interest rates, making them an appealing choice for homeowners seeking to trim their monthly payments — as long as you meet the eligibility terms. If you already have an FHA loan, you can choose between an FHA Simple Refinance or an FHA Streamline Refinance.
For those without an existing FHA loan, you have the option of an FHA cash-out refinance or an FHA 203(k) refinance, tailored for home improvements. Both avenues can lead to competitive Connecticut refinance rates and increased financial flexibility.
Refinancing with the VA
VA refinances, fully backed by the U.S. Department of Veterans Affairs, are designed to meet the financial needs of veterans. They offer some of the most competitive interest rates available in the market.
The Interest Rate Reduction Refinance Loan (IRRRL) is specifically for individuals with existing VA loans. This loan can help you secure a lower interest rate or switch from an adjustable to a fixed interest rate. While VA loans have strict eligibility requirements, they offer a unique opportunity for veterans to save money.
How to Compare Mortgage Refi Interest Rates
So now you know all the tricks for getting a lower refi interest rate. When you’re ready to pull the trigger, these are the steps you should take:
• Compare rates and fees from multiple lenders. Think about the trade-off between rate and fees.
• Focus on the APR (annual percentage rate), which includes fees, closing costs, and any discount points. This gives you a more accurate comparison than interest rates alone.
• Take care of your credit score, debt-to-income ratio, and home value to secure the best rates.
• Using a mortgage calculator to estimate your monthly payments.
Online Refinance Calculators
Using the right mortgage calculator can help you get a clearer sense of what your new monthly payment might be, and compare different refinance options.
Using a calculator is smart because it takes into account your current loan balance, the new interest rate, and the term of the loan to show you what your potential savings could be. This can help you make a more informed decision about whether refinancing is right for you.
You can also use a calculator to estimate how much equity is in your home, if you’re considering a home equity loan.
Run the numbers on your home loan.
-
Mortgage calculator
Punch in your home loan amount and a new interest rate, and we’ll estimate your payoff date.
-
Down payment calculator
Enter a few details about your home loan and we’ll provide your monthly mortgage payment.
-
Home affordability calculator
Provide us with a few details and see how much you can afford to spend on a home purchase.
Using the free calculators is for informational purposes only, does not constitute an offer to receive a loan, and will not solicit a loan offer. Any payments shown depend on the accuracy of the information provided.
The Takeaway
Mortgage refinancing is a useful financial tool that can help you reduce your monthly payments, consolidate debt, or tap into your home’s equity — when you can secure the best rate. Whether you’re considering a cash-out refinance, an FHA refinance, a VA refinance, or a 15-year mortgage refinance, be sure to weigh your financial goals against the requirements of each loan type, as well as the cost of refinancing itself.
By boosting your credit score, lowering your debt-to-income ratio, and carefully comparing mortgage rates in Connecticut, you can obtain better loan terms so that a refi makes sense.
SoFi can help you save money when you refinance your mortgage. Plus, we make sure the process is as stress-free and transparent as possible. SoFi offers competitive fixed rates on a traditional mortgage refinance or cash-out refinance.
A mortgage refinance could be a game changer for your finances.
FAQ
When is it a good idea to refinance your home?
The general rule of thumb is to refinance when you can get a significantly lower interest rate. Refinancing to a new, lower rate could help lower your monthly payments, pay off your loan faster, and build equity in your home more quickly. Alternatively, you may want to refinance to switch your ARM for a fixed-rate loan, or to remove a cosigner. Generally, the faster you can recoup your closing costs, the better.
How does refinancing affect your credit score?
Refinancing may cause a temporary dip in your credit score due to the hard inquiry and the new account that will show up on your credit report, assuming you take out the new loan. But the impact is usually minor and can be outweighed by the benefits of the lower mortgage rate. Be sure to consider all angles when researching a refi.
Do you have to pay closing costs when you refinance?
Yes, you’ll have to pay closing costs when you refinance your home. These costs can range from 2% to 5% of the loan amount, which can be a significant expense: from $6,000 to $15,000 on a $300,000 loan.
How much does a 1% lower rate change your payment?
A 1% reduction in your mortgage interest rate can make a big difference in your monthly payment. For example, the current Connecticut refinance rates are 6.88% for a 30-year fixed-rate loan. If you can reduce your interest rate by 1%, you can potentially save hundreds of dollars each month.
Can I lower my interest rate without refinancing?
If you’ve got some money to put down and you’re looking to lower your monthly mortgage payment, you might want to consider a mortgage recast. This is where you make a lump sum payment to your principal balance, and your lender re-amortizes the loan, which can lower your monthly payments. Another option is to request a loan modification directly from your lender. If you have a good credit score and a history of on-time payments, you may be able to get a lower interest rate without having to pay the cost of a full-on refi.
SoFi Mortgages
Terms, conditions, and state restrictions apply. Not all products are available in all states. See SoFi.com/eligibility-criteria for more information.
SoFi Loan Products
SoFi loans are originated by SoFi Bank, N.A., NMLS #696891 (Member FDIC). For additional product-specific legal and licensing information, see SoFi.com/legal. Equal Housing Lender.
*SoFi requires Private Mortgage Insurance (PMI) for conforming home loans with a loan-to-value (LTV) ratio greater than 80%. As little as 3% down payments are for qualifying first-time homebuyers only. 5% minimum applies to other borrowers. Other loan types may require different fees or insurance (e.g., VA funding fee, FHA Mortgage Insurance Premiums, etc.). Loan requirements may vary depending on your down payment amount, and minimum down payment varies by loan type.
¹FHA loans are subject to unique terms and conditions established by FHA and SoFi. Ask your SoFi loan officer for details about eligibility, documentation, and other requirements. FHA loans require an Upfront Mortgage Insurance Premium (UFMIP), which may be financed or paid at closing, in addition to monthly Mortgage Insurance Premiums (MIP). Maximum loan amounts vary by county. The minimum FHA mortgage down payment is 3.5% for those who qualify financially for a primary purchase. SoFi is not affiliated with any government agency.
†Veterans, Service members, and members of the National Guard or Reserve may be eligible for a loan guaranteed by the U.S. Department of Veterans Affairs. VA loans are subject to unique terms and conditions established by VA and SoFi. Ask your SoFi loan officer for details about eligibility, documentation, and other requirements. VA loans typically require a one-time funding fee except as may be exempted by VA guidelines. The fee may be financed or paid at closing. The amount of the fee depends on the type of loan, the total amount of the loan, and, depending on loan type, prior use of VA eligibility and down payment amount. The VA funding fee is typically non-refundable. SoFi is not affiliated with any government agency.
Non affiliation: SoFi isn’t affiliated with any of the companies highlighted in this article.
Disclaimer: Many factors affect your credit scores and the interest rates you may receive. SoFi is not a Credit Repair Organization as defined under federal or state law, including the Credit Repair Organizations Act. SoFi does not provide “credit repair” services or advice or assistance regarding “rebuilding” or “improving” your credit record, credit history, or credit rating. For details, see the FTC’s website .
Financial Tips & Strategies: The tips provided on this website are of a general nature and do not take into account your specific objectives, financial situation, and needs. You should always consider their appropriateness given your own circumstances.
Qualifying for the reward requires using a real estate agent that participates in HomeStory’s broker to broker agreement to complete the real estate buy and/or sell transaction. You retain the right to negotiate buyer and or seller representation agreements. Upon successful close of the transaction, the Real Estate Agent pays a fee to HomeStory Real Estate Services. All Agents have been independently vetted by HomeStory to meet performance expectations required to participate in the program. If you are currently working with a REALTOR®, please disregard this notice. It is not our intention to solicit the offerings of other REALTORS®. A reward is not available where prohibited by state law, including Alaska, Iowa, Louisiana and Missouri. A reduced agent commission may be available for sellers in lieu of the reward in Mississippi, New Jersey, Oklahoma, and Oregon and should be discussed with the agent upon enrollment. No reward will be available for buyers in Mississippi, Oklahoma, and Oregon. A commission credit may be available for buyers in lieu of the reward in New Jersey and must be discussed with the agent upon enrollment and included in a Buyer Agency Agreement with Rebate Provision. Rewards in Kansas and Tennessee are required to be delivered by gift card.
HomeStory will issue the reward using the payment option you select and will be sent to the client enrolled in the program within 45 days of HomeStory Real Estate Services receipt of settlement statements and any other documentation reasonably required to calculate the applicable reward amount. Real estate agent fees and commissions still apply. Short sale transactions do not qualify for the reward. Depending on state regulations highlighted above, reward amount is based on sale price of the home purchased and/or sold and cannot exceed $9,500 per buy or sell transaction. Employer-sponsored relocations may preclude participation in the reward program offering. SoFi is not responsible for the reward.
SoFi Bank, N.A. (NMLS #696891) does not perform any activity that is or could be construed as unlicensed real estate activity, and SoFi is not licensed as a real estate broker. Agents of SoFi are not authorized to perform real estate activity.
If your property is currently listed with a REALTOR®, please disregard this notice. It is not our intention to solicit the offerings of other REALTORS®.
Reward is valid for 18 months from date of enrollment. After 18 months, you must re-enroll to be eligible for a reward.
SoFi loans subject to credit approval. Offer subject to change or cancellation without notice.
The trademarks, logos and names of other companies, products and services are the property of their respective owners.
SOHL-Q125-162


More refinance resources.
-
How Much Does It Cost to Refinance a Mortgage?
-
How to Refinance a Home Mortgage Loan
-
7 Signs It’s Time for a Mortgage Refinance
Apply online or call for a complimentary mortgage consultation.
Credit Card Debt Consolidation Loans
Consolidate your credit card debt
with lower interest and save.
-
Low fixed rates
Ditch your high credit card interest and you could save big.
-
No fees required
No origination fees required, plus no prepayment or late fees.
-
One fixed payment
Consolidate multiple debts into one simple monthly payment.
-
$5K to $100K
Get funds as soon as the same day
you sign.‡
View your rate
Real reviews from SoFi members who’ve successfully paid off over $33B in credit card debt.
Ready to join them? Apply for a debt consolidation loan with SoFi.
The savings and experiences of members herein may not be representative of the experiences of all members. Savings are not guaranteed and will vary based on your unique situation and other factors.
Real reviews from SoFi members who’ve successfully paid off over $33B in credit card debt.
Ready to join them? Apply for a debt consolidation loan with SoFi.
The savings and experiences of members herein may not be representative of the experiences of all members. Savings are not guaranteed and will vary, based on your unique situation and other factors.
Received a mailer from
us?
>
Enter confirmation #
A SoFi credit card consolidation loan could help lower monthly payments.
-
Lower interest rates
You could save money by securing a lower fixed APR.
-
Simplified payments
Stop juggling multiple bills. Manage one easy monthly payment.
-
Lower your credit utilization
A personal loan for debt consolidation could help improve your credit score.
-
No fees required
Transparency matters. Enjoy a no-fees-required borrowing experience.
View your rate
What is a credit card consolidation loan? Expand to learn more.
expand={
/>
How does a credit card consolidation loan work?
A personal loan for debt consolidation is a savvy way to potentially save thousands in interest by refinancing high-rate credit cards and existing personal installment loan balances. You could have a clear path to paying off debt, with one fixed monthly payment to budget around and flexible terms from 2 to 7 years. Plus, with Direct Pay, you have the option to receive an even lower fixed rate when you opt to have SoFi pay off your lender(s) directly.
Why SoFi for credit card consolidation loans?
View your rate
Fast and easy application process
View your debt consolidation loan rate in minutes. Literally.
Flexible loan options
Choose payment terms that fit your needs. And your wallet.
Pay lenders directly
Choose Direct Pay and we’ll pay your lender up front so you don’t have to. Plus, you’ll receive a 0.25% rate discount.2
24/7 member support and financial guidance
Our team is here when you need us. Give us a call for a no-cost consultation at 855-456-7634.
{/* Horizon */}
See how a SoFi debt consolidation personal loan could save you money.
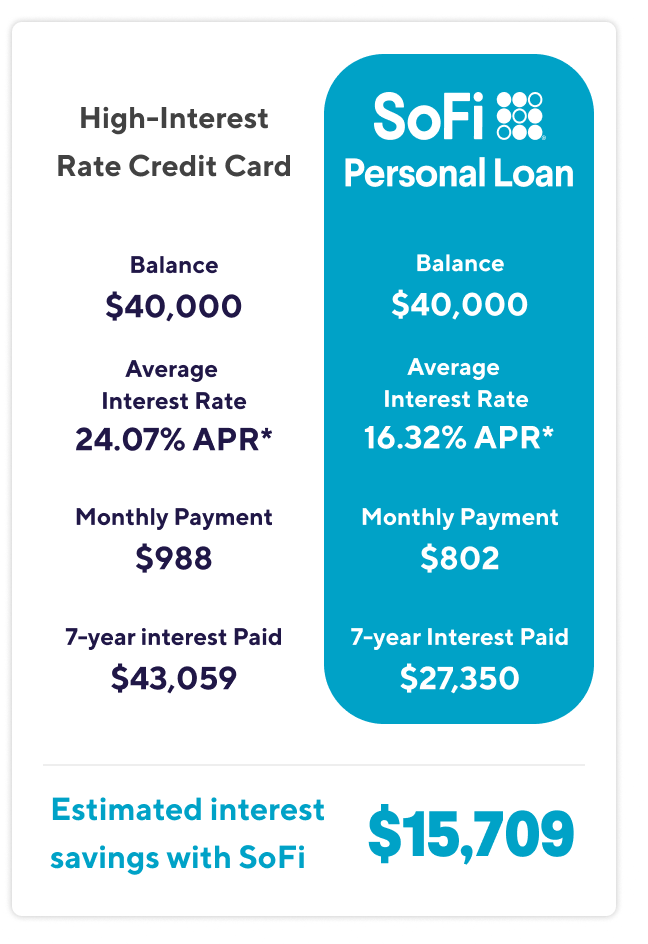
Many credit card holders opt to use a balance transfer to consolidate their debt, but this move often leaves people with the same problem they started with: high-interest credit card debt. With a debt consolidation loan, your low fixed rate won’t increase for the life of the loan–compared to just transferring your debt to another card.
View your rate
Example chart shows calculations based on a 5 year SoFi Personal Loan with a fixed rate of 14.90% APR, which is the rounded average median funded APR for SoFi Personal Loan borrowers who took out a loan with a 5 year term” from April 1 2023 – April 1 2024. Lowest rates are reserved for the most qualified borrowers. The ‘High-Interest Rate Credit-Card’ APR shown is the average credit card APR reported by Wallethub for Q1 2024 under their Good Credit category. The savings estimate also assumes that the borrower doesn’t take out any additional credit card debt during the same period. Both calculations assume 60 total monthly payments, no origination fee option selected and no pre-payment amounts.
Debt Consolidation Calculator
}
headingText=”Run the numbers with our debt consolidation calculator.”
imgAlt=”Personal loans calculator illustration”
imgSrc=”https://d32ijn7u0aqfv4.cloudfront.net/wp/wp-content/uploads/raw/pl-calculator.webp”
/>
How to get a debt consolidation loan online:
-
View your rate.
Get prequalified with no fees required and no obligation.
-
Select your loan and apply.
Choose the bill consolidation loan that works for you and complete your application.
-
Receive your funds.
Sign your document and funds are wired to your account—as soon as the same day.1
View your rate
Which credit card consolidation option is right for you?
Whether you’re searching for debt relief loans or balance transfers for credit card debt, we’re here to help. SoFi offers personal loan debt consolidation to help you take back control of your financial future.
3SOURCE: CreditKarma.com accessed on 1/29/24.
4SOURCE: Bankrate “What Is the Limit for a Balance Transfer Card?” accessed on 1/29/24.
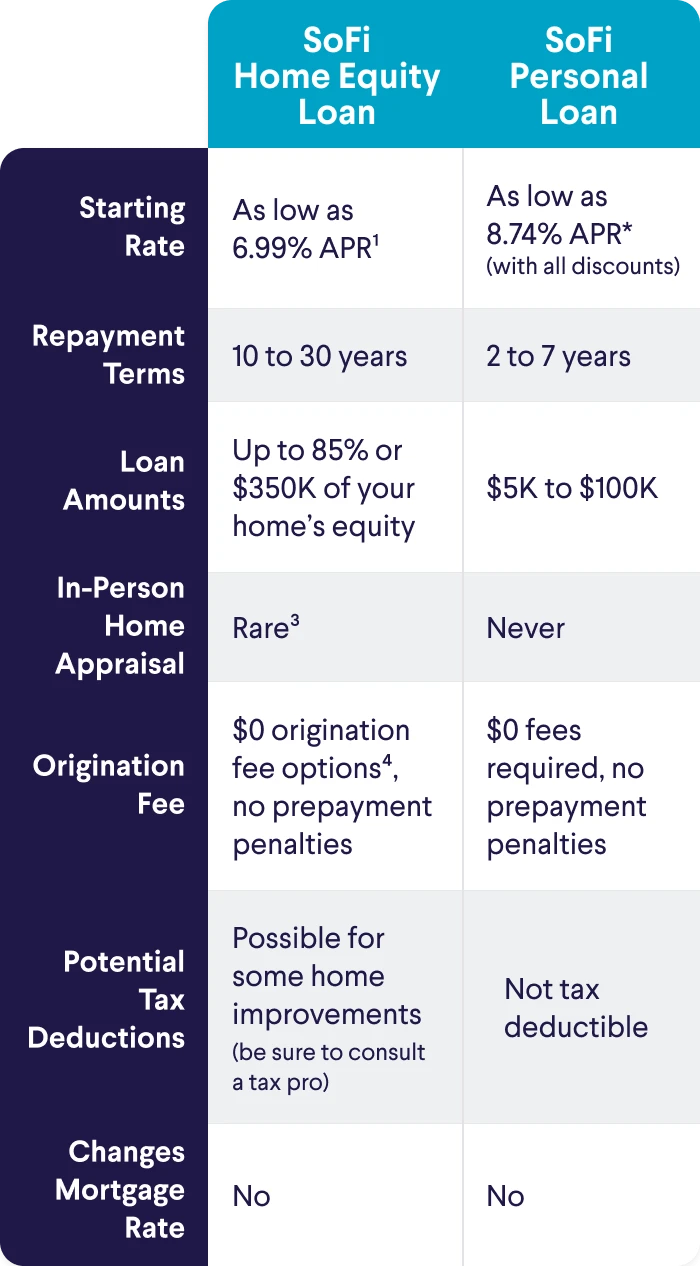
Another option to consider for credit card consolidation: our home equity loan.
See how a personal loan compares to a home equity loan to pay down high-interest credit card debt.
Compare options
Let’s find a loan that fits you.
Take a short quiz for a recommendation on a loan that meets your money needs now.
Learn more about credit consolidation loans:
FAQs
Applying for a debt consolidation loan requires a firm understanding of your credit, the amount of debt you are carrying, and remaining payments.
Three types of debt are commonly consolidated: credit card debt, medical debt, and high-interest personal loan debt. You may reduce the overall cost of repayment by securing better terms and interest. You’ll also have a single payment to keep track of instead of several.
To check the rates and terms you qualify for, SoFi conducts a soft credit pull that will not affect your credit score. However, if you choose a product and continue your application, we will request your full credit report from one or more consumer reporting agencies, which is considered a hard credit pull.
SoFi personal loans have fixed rates ranging from 7.74% APR to 35.49% APR. Your actual rate will be within the range of rates listed and will depend on the term you select, evaluation of your creditworthiness, income, and a variety of other factors. The lowest rate reflects the 0.25% autopay interest rate discount and a 0.25% direct deposit interest rate discount. SoFi rate ranges are current as of and are subject to change without notice.
Obtaining a debt consolidation loan is easier than you might think. There are no fees to get prequalified, and the process can be completed online. Once you’ve chosen a loan, the application is straightforward. Sign the documents, and the funds could be in your account the very same day.
A debt consolidation loan is a type of personal loan that allows you to combine multiple debts into one loan with a single monthly payment. This can help simplify your finances and make it easier to manage your debt. Debt consolidation loans can be used to consolidate various types of debt, including credit card debt, personal loans, and other high-interest debt.
Consolidating credit card debt does not cause you to lose your credit cards. It merely wipes out the debt on each card you include in the consolidation.
The easiest way to pay is to log in to the SoFi Android or iOS app, or log in to SoFi.com and make payments electronically via ACH, the same secure way most people get paid by their employers. Even better, setting up automatic payment by ACH earns you a 0.25% discount on your rate. You can also set up online bill pay to SoFi through your bank, or you can send in a paper check. Note that we do not currently accept payment via credit card.
You are welcome to make a larger payment than your current amount due and can pay off your loan at any time via your sofi.com account. There are no prepayment penalties should you decide to make additional payments.
You can contact us via chat or call us at (855) 456-SOFI (7634), Monday–Thursday 5am–7pm PT, Friday–Sunday 5am–5pm PT.
Debt settlement involves negotiating with creditors to reduce the total amount of debt owed. It is important to be cautious of potential scams and avoid companies that charge upfront fees. Debt settlement companies should be transparent about their fees and responsibilities. Unlike debt consolidation, which combines multiple debts into a single loan, debt settlement can negatively impact your credit score and carries significant risks. Individuals can also attempt to negotiate their own debts without a company. Understanding these differences can help you make an informed decision about your debt relief options.
We do not have a minimum income requirement. Loan eligibility depends on a number of additional factors, such as a responsible financial history, credit score, your monthly income vs. expenses, and professional experience. Please review our Eligibility Criteria for further details.
The best solution for consolidating your debt is a personal loan. It’s a versatile option that can help you pay off multiple debts with a lower interest rate than credit cards or other types of loans. This not only saves you money but also simplifies your debt management, making it easier to keep track of your finances.
Here are some of the benefits of using a personal loan to consolidate debt:
• You can secure a lower interest rate than what credit cards or other debts may be charging.
• Simplify your finances with a single monthly payment.
• You can pay off your debt more quickly.
• You can improve your credit score.
If you’re thinking about consolidating your debt, a personal loan is a solid choice. Compare rates from different lenders to snag the best deal for you.
See more FAQs
Get a personalized credit consolidation loan quote in minutes.
Fast, easy, safe. Apply for a debt consolidation loan and view your rate with our secure online application.
View your rate
Checking won’t affect your credit score.†
† To check the rates and terms you may qualify for, SoFi conducts a soft credit pull that will not affect your credit score. However, if you choose a product and continue your application, we will request your full credit report from one or more consumer reporting agencies, which is considered a hard credit pull and may affect your credit.
Terms and conditions apply. SOFI RESERVES THE RIGHT TO MODIFY OR DISCONTINUE PRODUCTS AND BENEFITS AT ANY TIME WITHOUT NOTICE. To qualify, a borrower must be a U.S. citizen or other eligible status, be residing in the U.S., and meet SoFi’s underwriting requirements. Not all borrowers receive the lowest rate. Lowest rates reserved for the most creditworthy borrowers. If approved, your actual rate will be within the range of rates at the time of application and will depend on a variety of factors, including term of loan, evaluation of your creditworthiness, income, and other factors. If SoFi is unable to offer you a loan but matches you for a loan with a participating bank, then your rate may be outside the range of rates listed above. Rates and Terms are subject to change at any time without notice. SoFi Personal Loans can be used for any lawful personal, family, or household purposes and may not be used for post-secondary education expenses. Minimum loan amount is $5,000. The average of SoFi Personal Loans funded in 2023 was around $33K. Information current as of 2/21/24. SoFi Personal Loans originated by SoFi Bank, N.A. Member FDIC. NMLS #696891 (www.nmlsconsumeraccess.org). See SoFi.com/legal for state-specific license details. See SoFi.com/eligibility for details and state restrictions.
Fixed rates from 7.74% APR to 35.49% APR reflect the 0.25% autopay interest rate discount and a 0.25% direct deposit interest rate discount. SoFi rate ranges are current as of 2/8/26 and are subject to change without notice. The average of SoFi Personal Loans funded in 2023 was around $33K. Not all applicants qualify for the lowest rate. Lowest rates reserved for the most creditworthy borrowers. Your actual rate will be within the range of rates listed and will depend on the term you select, evaluation of your creditworthiness, income, and a variety of other factors.
Loan amounts range from $5,000– $100,000. The APR is the cost of credit as a yearly rate and reflects both your interest rate and an origination fee of 0%-7%, which will be deducted from any loan proceeds you receive.
5 Autopay: The SoFi 0.25%autopay interest rate reduction requires you to agree to make monthly principal and interest payments by an automatic monthly deduction from a savings or checking account. The benefit will discontinue and be lost for periods in which you do not pay by automatic deduction from a savings or checking account. Autopay is not required to receive a loan from SoFi.
7 Direct Deposit Discount: To be eligible to potentially receive an additional (0.25%) interest rate reduction on your Personal Loan (your “Loan”), you must set up Direct Deposit with a SoFi Checking and Savings account offered by SoFi Bank, N.A., or enroll in SoFi Plus by paying the SoFi Plus Subscription Fee, all within 30 days of the funding of your Loan. Once eligible, you will receive this discount during periods in which you have enabled Direct Deposit to an eligible Direct Deposit Account in accordance with SoFi’s reasonable procedures and requirements to be determined at SoFi’s sole discretion, or during periods in which SoFi successfully receives payment of the SoFi Plus Subscription Fee. This discount will be lost during periods in which SoFi determines you have turned off Direct Deposit to your Checking and Savings account or in which you have not paid the SoFi Plus Subscription Fee. You are not required to enroll in Direct Deposit or to pay the SoFi Plus Subscription Fee to receive a Loan.
§ Awards or rankings are not indicative of future success or results. Neither SoFi Bank, N.A. nor its employees paid a fee in exchange for ratings. Awards and ratings are independently determined and awarded by their respective publications.
‡ Same-Day Personal Loan Funding: Same Day Funding means that most borrowers receive funds the same day when loan is approved and the loan agreement is signed by 5:30 PM ET on a business day. SoFi does not guarantee this, and delays may occur outside of our control, such as if inaccurate information is submitted, the receiving bank declines the transfer. Your bank may have rules on when the funds become available. Does not include personal loans originated with a SoFi partner bank.
^ Direct Pay: Terms and conditions apply. Offer good for personal loan customers with credit cards and personal loans in their name only and subject to lender approval. To receive the offer, you must: (1) register and/or apply through this landing page; (2) complete a loan application with SoFi within 90 days of your application submit date; (3) meet SoFi’s underwriting criteria; (4) apply 50% or more of your loan proceeds directly to your lenders/creditors. Once conditions are met and the loan has been disbursed, the interest rate shown in the Final Disclosure Statement will include an additional 0.25% rate discount. SoFi reserves the right to change or terminate the Direct Pay Rate Discount Program to unenrolled participants at any time with or without notice. It takes about 3 business days for your creditor/lender to receive payment after your loan is signed. You will be responsible for making all required payments to avoid credit card and other loan fees.
Excellent/4.1/5 star rating based on 10,538 reviews as of February 2, 2026. © 2025 Trustpilot, Inc. All rights reserved.
How long do I need to wait to reapply after my Personal Loan application has been declined?
You will need to wait at least 30 days before re-applying for a Personal Loan with the same borrower(s). You are welcome to retry at any time with a co-borrower, if the previous application was as a single borrower. If you initially applied with a co-borrower, you can retry as a single borrower or with a different co-borrower.
Current Mortgage Refinance Rates in New York Today
NEW YORK MORTGAGE REFINANCE RATES TODAY
Current mortgage refinance rates in
New York.
Apply online or call for a complimentary mortgage consultation.
Compare mortgage refinance rates in New York.
Key Points
• Mortgage refinance rates are influenced by economic factors such as the bond market, inflation, and housing demand.
• Securing a mere 1% drop in a home loan refinance rate can save a significant amount of interest over the life of the loan.
• Some borrowers refinance to change the rate on their loan. Some are seeking a different loan term. And many are looking to change both.
• A cash-out refinance lets owners tap into home equity and pull out a lump sum in cash to be used for a renovation or other big expense.
• VA refinances, backed by the U.S. Department of Veterans Affairs, offer some of the most competitive mortgage refinance rates and minimal closing costs.
• Refinancing to a 15-year mortgage can be a smart move, as it often means paying less interest over the life of the loan, although it does bring higher monthly payments.
Introduction to Mortgage Refinance Rates
If you’re dreaming about a lower interest rate for your home loan, a mortgage refinance might be for you. To determine whether or not going through a mortgage refinance and getting a new home loan to replace your existing one is worthwhile, you’ll want to take a close look at mortgage refinance rates in New York. The reason you want to refinance will determine the type of refinance you choose, and that choice will in turn affect the interest rate you are offered. This guide will help you understand how mortgage refinance rates work and the steps you can take to get the best rate in today’s market.
💡 Quick Tip: How soon can you refinance your mortgage? It varies by loan type, but typical waiting periods are 6 to 12 months.
Where Do Mortgage Refi Interest Rates Come From?
Historically, the strongest indicator of the direction current mortgage rates are headed lies in the bond market, and specifically in the performance of the 10-year U.S. Treasury Note. When its rates rise, mortgage interest tends to head in the same direction. Another factor is the housing market. When the market cools and more homes are available than there are buyers, lenders may lower rates to keep attracting customers. Then there is the overall economy: A strong job market and economic growth can lead interest rates to rise, while a recession is usually accompanied by lower interest rates. All of these factors work together like instruments in a symphony, and understanding this composition can help you tune into the best time to refinance your mortgage.
How Interest Rates Affect Home Affordability
Just as with your existing mortgage, interest rates will play a significant role in determining the affordability of a refinance. Your monthly payment is determined by your loan amount, repayment term, and interest rate. For example, a $375,000 loan with a 6.00% mortgage refinance rate and a 30-year repayment term will have a monthly payment of $2,248. The same loan with a 7.00% interest rate has a $2,495 monthly payment. More importantly, the lower interest rate will save you tens of thousands of dollars over the life of the loan. Although a fraction of a percentage point adds only a little to your monthly payment, it can add up to thousands or even tens of thousands of dollars over your loan term.
Why Refinance in New York?
Refinancing your mortgage can be a smart financial move, but it’s not something to jump into without doing your homework. You’ll want to have at least 20% equity in your home before refinancing, especially if you’re cashing out some equity (more on that below). Below are some of the reasons borrowers choose to change up their home loan.
Common Reasons to Refinance a Mortgage
• Lower interest rates are now available, or your credit profile has improved and you now qualify for a better rate.
• You want to adjust your repayment term: either extend it for lower monthly payments, or shorten it to save on interest (a shorter term means a higher monthly payment).
• You need to cash out home equity to cover a significant expense, such as renovations, education expenses, or debt consolidation.
• You have an adjustable-rate loan, and you want to lock in a fixed rate to protect against future interest increases.
• You have an FHA mortgage (backed by the Federal Housing Administration), you’ve reached 20% equity in your home, and you want to rid yourself of the FHA mortgage insurance premium.
Think the time might be right to refinance? Our guide to how to refinance a mortgage will help you work through the process.
How to Get the Best Available Mortgage Refi Interest Rate
There are a few steps you should take early in the process that will help you to secure a competitive mortgage refinance rate:
• Make sure you are taking good care of your credit score by paying bills on time and avoiding new debt.
• Lower your debt-to-income ratio by settling outstanding debts to the extent possible.
• Consider whether you have cash on hand that you could use to buy mortgage points (also known as discount points) to lower your interest rate.
• Examine your monthly spending to determine whether you might be able to afford a larger monthly payment, so that you can pay your new mortgage off over a shorter term (and save on interest).
Next step? Take a close look at mortgage interest rates in New York.
Understand Trends in New York Mortgage Interest Rates
In 2021, the average 30-year fixed mortgage rate in the U.S. hovered just over 3.00%. By 2023, it had shot up to 7.00%. With such a variation — and with such tantalizingly low rates just a few years back — it can be hard to know whether the rates you’re currently seeing are a good value. Take a closer look at how New York rates stacked up between 2000 and 2018 (the last year the Federal Housing Finance Agency kept state-specific rates.)
Historical U.S. Mortgage Interest Rates
Looking at these historical trends over a much longer time can help you decide when the time is right for you to refinance. Let’s just say rates as low as 3.00% don’t come around very often!
Historical Interest Rates in New York
New York’s mortgage refinance rates generally follow the same trends as national rates, hovering slightly below the national average.
| Year | New York Rate | National Rate |
|---|---|---|
| 2000 | 8.10 | 8.14 |
| 2001 | 7.02 | 7.03 |
| 2002 | 6.47 | 6.62 |
| 2003 | 5.63 | 5.83 |
| 2004 | 5.70 | 5.95 |
| 2005 | 5.78 | 6.00 |
| 2006 | 6.44 | 6.60 |
| 2007 | 6.40 | 6.44 |
| 2008 | 6.03 | 6.09 |
| 2009 | 5.06 | 5.06 |
| 2010 | 4.80 | 4.84 |
| 2011 | 4.55 | 4.66 |
| 2012 | 3.62 | 3.74 |
| 2013 | 3.77 | 3.92 |
| 2014 | 4.08 | 4.24 |
| 2015 | 3.81 | 3.91 |
| 2016 | 3.62 | 3.72 |
| 2017 | 3.91 | 4.03 |
| 2018 | 4.37 | 4.57 |
Choose the Right Mortgage Refi Type
Refinance rates are usually a bit higher than the rates you might get for a purchase mortgage. But they can also vary depending on the type of refinance loan you choose. There are many different types of mortgage refinance loans with a variety of features. Here are some of the most common.
Conventional Refi
Conventional refinance loans, also known as rate-and-term refis, typically have higher interest rates compared to government-backed loans such as FHA loans. A conventional refinance is an ideal option for homeowners seeking to modify their interest rate, loan duration, or both. It offers the potential to secure a lower mortgage refinance rate or a shorter loan term. Conventional refis are best suited for individuals with a strong credit history and sufficient home equity. Two common types are the 15-year refi and the adjustable-rate refi.
15-Year Mortgage Refi
Refinancing to a 15-year mortgage can lead to big savings on interest in the long run, although in the short term it means larger monthly payments. Some borrowers, especially those nearing retirement or those who know they will be facing college expenses in the future, refi into a shorter term to close out their mortgage before other expenses hit.
Adjustable Rate Mortgage Refi
Adjustable-rate mortgages (ARMs) often offer lower initial mortgage refinance rates than fixed-rate loans, making them an appealing choice for homeowners who expect to move within a few years. If you currently have a 30-year fixed-rate mortgage but plan to sell your home in the next few years, switching to an ARM could potentially reduce your monthly payments. Of course, other borrowers refinance because they want to get out of an adjustable-rate loan and into a fixed-rate mortgage. It’s a personal choice.
Cash-Out Refi
A cash-out refinance is a smart way to leverage your home equity. Here’s how it works: You take out a new mortgage that’s larger than your current one, and the difference is handed to you in a lump sum. Imagine your home is valued at $500,000, and you owe $300,000. With a cash-out refinance of $400,000, you pay off your first mortgage and have $100,000 left over for debt consolidation, home improvements, or other expenses. While the rates might be a tad higher than a standard refi, the benefits of a cash-out refi can be a game-changer for managing your financial commitments.
FHA Refi
An FHA refinance can be your ticket to lower mortgage refinance rates and more flexible qualifying criteria. There are two main types: the FHA Streamline Refinance is exclusive to those with existing FHA loans. FHA cash-out refinances and FHA 203(k) refinances, which can finance home renovations, are available for those who didn’t start with an FHA loan.
VA Refi
A VA refinance, guaranteed by the U.S. Department of Veterans Affairs, is available to VA loan holders. These loans are known for offering some of the lowest mortgage refinance rates, along with minimal closing costs. The Interest Rate Reduction Refinance Loan (IRRRL) can be used to refinance an existing VA loan to a lower interest rate or from an ARM to a fixed-rate mortgage.
Compare Mortgage Refi Interest Rates
Once you’ve closed in on the type of refinance you are considering, seek out interest rate offers and terms from multiple lenders to determine who has the best rate and term combo for your financial situation. Make sure to check the annual percentage rate (APR) on loan offers. (You might see offers that mention a no-closing-cost refinance but this often means any costs are rolled into the amount of your loan.) During the comparison process, you’ll probably find a mortgage refinance calculator helpful.
Use an Online Refinance Calculator
Online refinance calculators are incredibly helpful tools for getting a handle on mortgage refinancing costs. You probably used a mortgage calculator when looking for your first home loan — a refinance calculator will be similar. Here are a few useful calculator tools:
Run the numbers on your home loan.
-
Mortgage calculator
Punch in your home loan amount and a new interest rate, and we’ll estimate your payoff date.
-
Down payment calculator
Enter a few details about your home loan and we’ll provide your monthly mortgage payment.
-
Home affordability calculator
Provide us with a few details and see how much you can afford to spend on a home purchase.
Using the free calculators is for informational purposes only, does not constitute an offer to receive a loan, and will not solicit a loan offer. Any payments shown depend on the accuracy of the information provided.
The Takeaway
Refinancing your mortgage can be a smart financial move, but it’s not something you should rush into. By understanding the different types of refinances — including cash-out, FHA, VA, and 15-year mortgages, among others — you can make an informed decision. You can also take steps to strengthen your credit score and reduce other debts before you enter the mortgage refinance process. This will help you get the best rate and terms in New York.
SoFi can help you save money when you refinance your mortgage. Plus, we make sure the process is as stress-free and transparent as possible. SoFi offers competitive fixed rates on a traditional mortgage refinance or cash-out refinance.
A mortgage refinance could be a game changer for your finances.
FAQ
Can I lower my interest rate without refinancing my mortgage?
It’s difficult to lower a mortgage interest rate without a refinance, but you can reduce your monthly payments by doing a mortgage recast. A recast involves making a lump-sum payment toward your principal balance. Your lender can then “recast” your monthly payment amount to reflect the lower principal. If you’re facing financial hardship, you could also explore a loan modification by talking to your lender. Of course, if you have a solid credit score and stellar payment history, you can always ask your lender to modify your rate, but the lender is likely to suggest a refi or recast instead.
Is there a fee to recast your mortgage?
There is a fee to recast your mortgage, but it is not as expensive as the fees associated with a mortgage refinance. The recast fee is usually small, ranging from $100 to $500, depending on your lender.
How much are closing costs on a refinance?
On average, closing costs on a refinance typically range from 2% to 5% of the loan amount. For a $300,000 refinance, that could mean shelling out anywhere from $6,000 to $15,000. It’s a hefty sum, no doubt, and one that you’ll want to factor into your decision-making process. Some lenders offer a “no-closing-cost refinance” but often this just means the costs are rolled into the amount borrowed or reflected in a higher interest rate.
Does refinancing hurt your credit score?
Refinancing might cause a slight dip in your credit score, but the potential savings from a refinance could be well worth it. Refinancing your mortgage can potentially save you a lot of money over the life of your loan, making it a smart financial move for many homeowners looking to improve their financial health.
SoFi Mortgages
Terms, conditions, and state restrictions apply. Not all products are available in all states. See SoFi.com/eligibility-criteria for more information.
SoFi Loan Products
SoFi loans are originated by SoFi Bank, N.A., NMLS #696891 (Member FDIC). For additional product-specific legal and licensing information, see SoFi.com/legal. Equal Housing Lender.
*SoFi requires Private Mortgage Insurance (PMI) for conforming home loans with a loan-to-value (LTV) ratio greater than 80%. As little as 3% down payments are for qualifying first-time homebuyers only. 5% minimum applies to other borrowers. Other loan types may require different fees or insurance (e.g., VA funding fee, FHA Mortgage Insurance Premiums, etc.). Loan requirements may vary depending on your down payment amount, and minimum down payment varies by loan type.
¹FHA loans are subject to unique terms and conditions established by FHA and SoFi. Ask your SoFi loan officer for details about eligibility, documentation, and other requirements. FHA loans require an Upfront Mortgage Insurance Premium (UFMIP), which may be financed or paid at closing, in addition to monthly Mortgage Insurance Premiums (MIP). Maximum loan amounts vary by county. The minimum FHA mortgage down payment is 3.5% for those who qualify financially for a primary purchase. SoFi is not affiliated with any government agency.
†Veterans, Service members, and members of the National Guard or Reserve may be eligible for a loan guaranteed by the U.S. Department of Veterans Affairs. VA loans are subject to unique terms and conditions established by VA and SoFi. Ask your SoFi loan officer for details about eligibility, documentation, and other requirements. VA loans typically require a one-time funding fee except as may be exempted by VA guidelines. The fee may be financed or paid at closing. The amount of the fee depends on the type of loan, the total amount of the loan, and, depending on loan type, prior use of VA eligibility and down payment amount. The VA funding fee is typically non-refundable. SoFi is not affiliated with any government agency.
Non affiliation: SoFi isn’t affiliated with any of the companies highlighted in this article.
Disclaimer: Many factors affect your credit scores and the interest rates you may receive. SoFi is not a Credit Repair Organization as defined under federal or state law, including the Credit Repair Organizations Act. SoFi does not provide “credit repair” services or advice or assistance regarding “rebuilding” or “improving” your credit record, credit history, or credit rating. For details, see the FTC’s website .
Financial Tips & Strategies: The tips provided on this website are of a general nature and do not take into account your specific objectives, financial situation, and needs. You should always consider their appropriateness given your own circumstances.
Qualifying for the reward requires using a real estate agent that participates in HomeStory’s broker to broker agreement to complete the real estate buy and/or sell transaction. You retain the right to negotiate buyer and or seller representation agreements. Upon successful close of the transaction, the Real Estate Agent pays a fee to HomeStory Real Estate Services. All Agents have been independently vetted by HomeStory to meet performance expectations required to participate in the program. If you are currently working with a REALTOR®, please disregard this notice. It is not our intention to solicit the offerings of other REALTORS®. A reward is not available where prohibited by state law, including Alaska, Iowa, Louisiana and Missouri. A reduced agent commission may be available for sellers in lieu of the reward in Mississippi, New Jersey, Oklahoma, and Oregon and should be discussed with the agent upon enrollment. No reward will be available for buyers in Mississippi, Oklahoma, and Oregon. A commission credit may be available for buyers in lieu of the reward in New Jersey and must be discussed with the agent upon enrollment and included in a Buyer Agency Agreement with Rebate Provision. Rewards in Kansas and Tennessee are required to be delivered by gift card.
HomeStory will issue the reward using the payment option you select and will be sent to the client enrolled in the program within 45 days of HomeStory Real Estate Services receipt of settlement statements and any other documentation reasonably required to calculate the applicable reward amount. Real estate agent fees and commissions still apply. Short sale transactions do not qualify for the reward. Depending on state regulations highlighted above, reward amount is based on sale price of the home purchased and/or sold and cannot exceed $9,500 per buy or sell transaction. Employer-sponsored relocations may preclude participation in the reward program offering. SoFi is not responsible for the reward.
SoFi Bank, N.A. (NMLS #696891) does not perform any activity that is or could be construed as unlicensed real estate activity, and SoFi is not licensed as a real estate broker. Agents of SoFi are not authorized to perform real estate activity.
If your property is currently listed with a REALTOR®, please disregard this notice. It is not our intention to solicit the offerings of other REALTORS®.
Reward is valid for 18 months from date of enrollment. After 18 months, you must re-enroll to be eligible for a reward.
SoFi loans subject to credit approval. Offer subject to change or cancellation without notice.
The trademarks, logos and names of other companies, products and services are the property of their respective owners.
SOHL-Q125-187


More refinance resources.
-
How Much Does It Cost to Refinance a Mortgage?
-
How to Refinance a Home Mortgage Loan
-
7 Signs It’s Time for a Mortgage Refinance
Apply online or call for a complimentary mortgage consultation.
Stay up to date on the latest business news and stock market happenings.