
Table of Contents
- Key Takeaways
- Total Student Loan Debt in the U.S.
- Average Student Loan Debt by Degree Type
- Student Loan Debt by Borrower Demographics
- Student Loan Debt by State
- Student Loan Delinquency and Default Rates
- Student Loan Repayment Statistics
- Student Loan Forgiveness Statistics
- Impact of Student Loan Debt on Life Milestones
Average student loan debt stands at $39,547, according to the Education Data Initiative. That figure tells only part of the story. Nationwide, total U.S. student loan debt reached $1.86 trillion in the first quarter of 2026, according to the Federal Reserve.
Numbers this large raise plenty of questions, so this page breaks down the latest student loan debt statistics for 2026 across eight categories:
• Totals
• Debt by degree
• Borrower demographics
• State
• Delinquency
• Repayment
• Forgiveness
• Life milestones
And since a trillion-dollar figure is only as meaningful as the people behind it, see how many people have student loans in the U.S. for context on the borrower population.
Key Takeaways
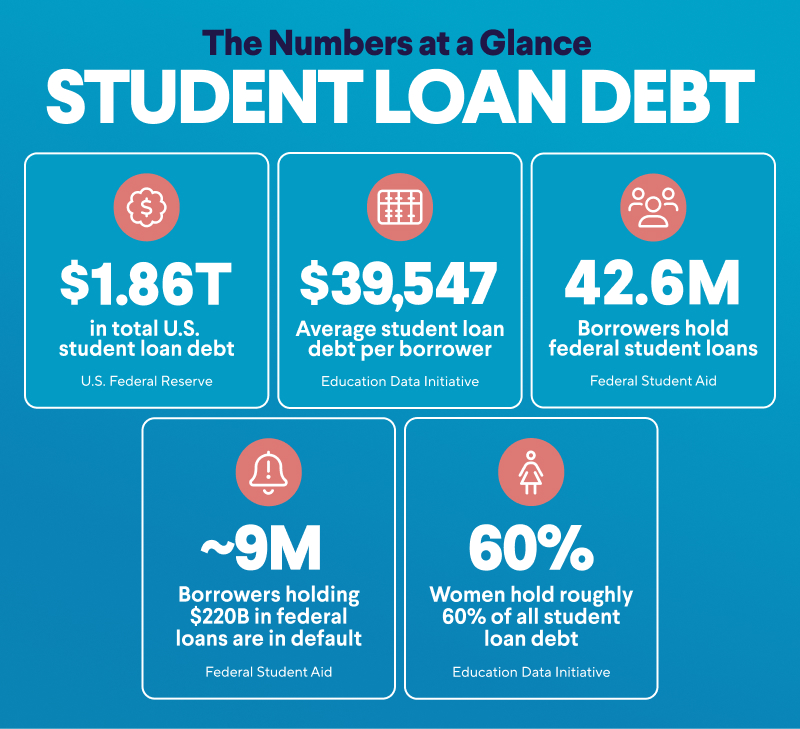
• Total U.S. student loan debt stands at $1.86 trillion.
• The average amount of student loan debt is $39,547 per borrower.
• The number of American borrowers holding federal student loans is 42.6 million.
• About 9 million borrowers with $220 billion in outstanding federal student loans are in default.
• Women hold roughly 60% of all student loan debt.
Total Student Loan Debt in the U.S.
These figures capture the size and structure of the U.S. student loan market in early 2026, drawing on Federal Reserve, Federal Student Aid, and Education Data Initiative data.
• Total outstanding student loan debt, federal and private combined, reached $1.86 trillion in Q1 2026.
• Federal loan debt accounts for about 91% of outstanding student loan debt, while private loans account for about 9%.
• Federal student loans account for approximately $1.7 trillion in outstanding debt held by 42.6 million borrowers as of March 2026.
• Private student loan debt totals roughly $167.4 billion.
• The federal government lends about $87.2 billion to postsecondary students each year.
• The average federal balance is $39,547; average balance rises to as much as $43,333 when private loans are included.
• Most borrowers pay between $200 and $299 a month.
• Student loan debt is the third-largest category of U.S. household debt, behind mortgages and auto loans.
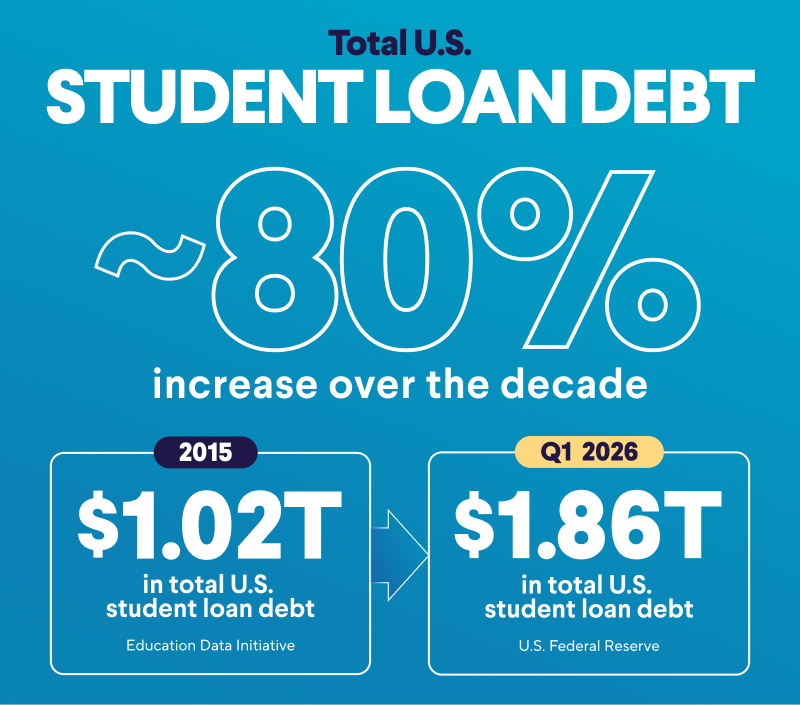
• Total student loan debt grew from $1.02 trillion in 2015 to $1.83 trillion in 2025, an increase of roughly 80% over the decade.
For a fuller breakdown of typical balances, see what is the average student loan debt.
Average Student Loan Debt by Degree Type
Average college debt can rise sharply with each step up in degree, as the stat blocks below show. All figures come from the Education Data Initiative and reflect total debt unless noted.
• Associate degree: $23,854 in average total student loan debt.
• Bachelor’s degree: $29,490 for graduates of public institutions and $33,689 for graduates of private nonprofit institutions.
• Master’s degree: $69,624 for public-institution graduates and $95,381 for private nonprofit graduates; the average master’s borrower owes $81,870 in total.
• Master of Business Administration (MBA): $76,996 in average total debt, with $60,118 from graduate school alone.
• Doctoral/Ph.D.: $77,331 average for research doctorate holders, including undergraduate loans.
• Professional degree: Medical school graduates owe an average of $235,788, and law graduates $167,399; professional-doctorate graduates of private nonprofit schools carry $281,817 in total debt.
• Average monthly payments climb with degree level, from about $190 for associate-degree borrowers to roughly $300 for bachelor’s and $640 for master’s borrowers.
Medical school debt can hit especially hard. SoFi’s own research on medical school debt found that more than 61% of health professionals carry over $100,000 in medical school debt.
That burden isn’t distributed evenly across careers, though. See average student loan debt by career for a closer look at who carries the most.
Student Loan Debt by Borrower Demographics
Student debt is not spread evenly by demographics. Drawing on Education Data Initiative figures, the breakdowns below show how balances differ by age, gender, and race.
• By age: Borrowers aged 50–61 carry the highest average balance at $46,790 per person.
Borrowers under 40 owe 54.5% of all student loan debt, amounting to about $869 billion.
Average federal balances rise with age: $14,162 for borrowers under 25, $33,150 at ages 25–34, $44,288 at ages 35–49, and $43,392 for those 62 and older.
• By gender: Women hold 60.3% of all student loan debt, which amounts to roughly $929 billion.
The average student debt for women in the U.S. is $31,276.
Twelve years after graduation, white men have paid off up to 44% of their debt, compared with 28% for white women.
• By race: Black graduates owe an average of $25,000 more than white graduates.
Four years after graduation, Black borrowers carry balances 88.3% higher than white borrowers. Black student loan borrowers owe an average of $53,340.
For more on the nuance of how balances vary by age, see how much debt your generation carries.
Student Loan Debt by State
Average federal student loan debt ranges from $29,115 to $54,561 per borrower, depending on the state, per the Education Data Initiative. That’s a gap of more than $25,000 between the lowest and highest. These figures reflect only federal loans, as state-level private loan data is limited.
• Highest: The District of Columbia, at $54,561 per borrower.
• Lowest: North Dakota, at $29,115, the only state under $30,000.
• Second lowest: Wyoming, at $30,631.
Other high-debt states include Maryland ($43,781), Georgia ($42,226), and Virginia ($40,287).
Florida carries one of the largest total balances, at $108.1 billion owed by state residents.
The District of Columbia also has the highest share of residents with student debt, about 16.7%.
Hawaii residents are the least likely to carry student debt, at 8.5%.
For a fuller state-by-state breakdown, see average student loan debt by state.
Student Loan Delinquency and Default Rates
Delinquency and default have climbed sharply since pandemic-era repayment protections ended. Figures come from Federal Student Aid (March 2026), the Federal Reserve Bank of New York (Q1 2026), and the Urban Institute (2025).
• About 9 million borrowers holding $220 billion in loans were in default as of March 2026, more than 13% of the federally managed portfolio.
• About 15.9% of borrowers are at least 60 days past due, a return to prepandemic levels: The rate was 16.7% in August 2019, before the payment pause drove it to a low of 2.3%.
• About 20% of borrowers in active repayment, or roughly 3.5 million, are at least 30 days delinquent, including 1.4 million at risk of default within six months.
• The 90-plus-day delinquency rate stood at 10.3% of balances in Q1 2026, up from 9.6% in Q4 2025.
• Federal loans enter default after 270 days of missed payments, about nine months.
• Delinquency runs highest in the South, where more than one in five borrowers in Louisiana (22.6%), Mississippi (22.3%), and Georgia (21.1%) were past due in 2025.
• Default can trigger wage garnishment, seizure of tax refunds, and loss of eligibility for future federal aid.
Student Loan Repayment Statistics
Repayment figures below come from Federal Student Aid (data as of March 2026) and the U.S. Education Department.
• American borrowers holding federal student loans total 42.6 million, totaling $1.7 trillion as of March 2026.
About 13 million borrowers are enrolled in an income-driven repayment (IDR) plan — roughly 44% of those in repayment.
• More than 6.5 million borrowers remained in SAVE plan forbearance at the end of 2025 as the program wound down amid litigation.
• About 44.6% of borrowers are on the standard 10-year repayment plan with fixed payments.
• The average borrower takes about 20 years to pay off their student loans.
• 8.4 million borrowers have at least one loan in forbearance, and about 3.6 million have a loan in deferment, as of March 2026.
A new repayment assistance plan (RAP) launched July 1, 2026, and will replace existing income-driven plans. Borrowers with loans made before that date have until July 1, 2028, to choose RAP, a tiered standard plan, or income-based repayment (IBR).
Learn more about income-driven repayment plans.
Student Loan Forgiveness Statistics
Forgiveness figures reflect the most recent program data from the Education Data Initiative, Federal Student Aid, and the U.S. Education Department.
• Federal Student Aid has discharged $87.6 billion across about 1.18 million borrowers through the Public Service Loan Forgiveness Program (PSLF) and related programs, an average of roughly $78,200 per PSLF borrower (data through September 2025).
• Early in the program, between 2018 and 2020, 99.7% of PSLF applications were rejected.
• Teacher Loan Forgiveness has discharged $3.87 billion across 469,867 teachers, for an average of $8,497.
• Between 2018 and mid-2025, the government discharged 719,297 federal loans totaling $14.23 billion, an average of about $2 billion a year.
• Federal forgiveness applications have an 11.2% acceptance rate.
• A final PSLF rule taking effect July 1, 2026, narrows which employers qualify, though legal challenges could affect the timeline.
• Under the new RAP, any remaining balance is forgiven after 360 payments over at least 30 years—longer than the 20- to 25-year timeline under previous income-driven plans.
See SoFi’s guide to student loan forgiveness programs and the PSLF program for eligibility details.
Impact of Student Loan Debt on Life Milestones
Beyond monthly budgets, student debt shapes major decisions about homeownership, family, and career, drawing on Education Data Initiative figures, a March 2025 Council on Contemporary Families review, and a February 2025 MissionSquare Research Institute study.
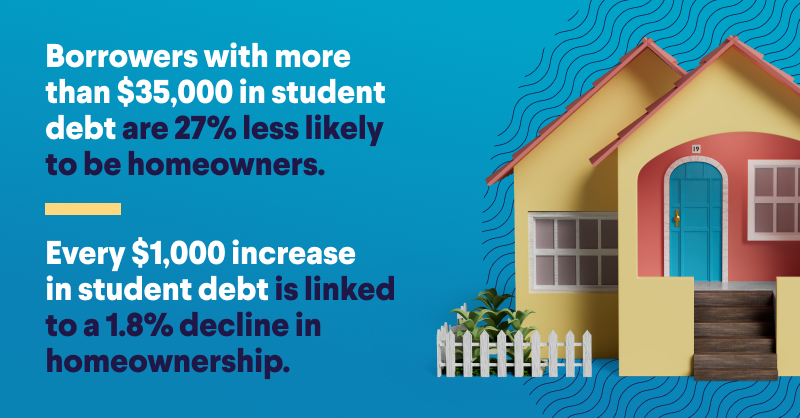
• Homeownership: Borrowers with more than $35,000 in debt are 27% less likelyto be homeowners.
Every $1,000 increase in student debt has been linked to a 1.8% decline in homeownership.
• Marriage and family: Adults with student debt are less likely to marry or have children; about 1 in 5 recent graduates with loans report delaying marriage, and a similar share are putting off children.
• Career: Student debt influences job-acceptance decisions for 56% of public-sector and 62% of private-sector workers.
Public-sector employees with student debt are 14% more likely to view their retirement savings as inadequate.
Explore how student loan debt and a mortgage interact, and the broader impact of student loan debt on the economy.
The Takeaway
With total balances above $1.8 trillion and delinquency back at prepandemic levels, student loan debt remains one of the largest financial pressures facing American households.
But borrowers aren’t without options. Income-driven repayment plans can lower monthly obligations. Forgiveness programs like PSLF can eliminate debt entirely for those who qualify. And refinancing can bring down the interest rate or payment amount for borrowers who no longer need federal protections.
That last point comes with a real trade-off: Refinancing federal loans with a private lender means giving up certain federal protections. It’s a decision worth weighing carefully, not rushing into.
For borrowers with private loans or those who have exhausted federal options, SoFi’s student loan refinancing could help lower rates or monthly payments.
With SoFi, refinancing is fast, easy, and all online. We offer competitive fixed and variable rates.
SoFi Student Loan Refinance SoFi Loan Products
Terms and conditions apply. SoFi Refinance Student Loans are private loans. When you refinance federal loans with a SoFi loan, YOU FORFEIT YOUR ELIGIBILITY FOR ALL FEDERAL LOAN BENEFITS, including all flexible federal repayment and forgiveness options that are or may become available to federal student loan borrowers including, but not limited to: Public Service Loan Forgiveness (PSLF), Income-Based Repayment, Income-Contingent Repayment, extended repayment plans, PAYE or SAVE. Lowest rates reserved for the most creditworthy borrowers. Learn more at SoFi.com/eligibility. SoFi Refinance Student Loans are originated by SoFi Bank, N.A. Member FDIC. NMLS #696891 (www.nmlsconsumeraccess.org).
SoFi loans are originated by SoFi Bank, N.A., NMLS #696891 (Member FDIC). For additional product-specific legal and licensing information, see SoFi.com/legal. Equal Housing Lender.
Non affiliation: SoFi isn’t affiliated with any of the companies highlighted in this article.
SOSLR-Q326-072