
Portfolio Change, Jobs, & GDP Data – Week of Apr. 13, 2017
Last week we changed our portfolio allocations, increasing exposure to emerging markets and foreign exchange as well as taking broader fixed income exposure. But first we’ll cover the economy. A huge miss on the jobs report and recent threats of military escalation in the Far and Middle East sent bond yields lower while the dollar continued to depreciate against many of the world’s currencies. The disconnect continues between so-called “soft” survey data and the more traditional economic statistics. However, optimism remains elevated even as more traditional measures of economic activity indicated subpar growth in the first quarter.
Jobs Report
The consensus expectations for jobs added in the U.S. economy in March on a seasonally adjusted basis was 180,000. Actual jobs added were just over half that number, at 98,000. Equity markets initially sold off and treasuries rallied as some market participants thought this suggested a slowing of the U.S. economy. Markets later recovered and we find ourselves in agreement with the optimists. First, the jobs number has historically been volatile. We can see below that the number is prone to large misses relative to expectations.
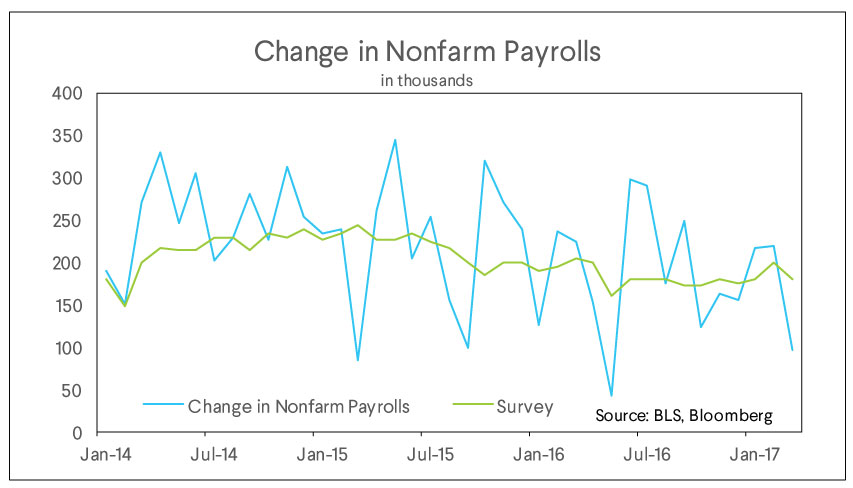
In addition, the job market still looks strong. Anytime we add fewer jobs than expected in a given month the debate shifts to whether or not it is a supply or demand problem. If the number of jobs added was low because firms demanded little labor, that could suggest the start of an economic slowdown. If, on the other hand, job gains slowed despite a strong demand for labor it could be a good thing. It suggests firms will need to raise wages to attract the labor required to meet final demand. This increases personal income and consumption, pushing the economy forward. Often both supply and demand play a part. For instance, this month’s reading was likely impacted by weather, as a warmer January and February pushed forward construction hiring.
More broadly, we see the labor supply story as more compelling. We can see below the time series of job openings from the Bureau of Labor Statistics (BLS). This number has continued to rise and stands at over 5.5 million job openings. Absent a major coordination failure, it makes little sense that job openings would continue to rise, while at the same time job creation slows because of a lack of firm demand for labor.

Soft vs Hard Data
As we discussed last week, the divergence between “soft” and “hard” measures of economic growth is perplexing. The first chart below presents another manifestation. Two regional Federal Reserve Banks have created “nowcasts” of economic activity. These econometric models seek to estimate current economic activity because the official GDP numbers won’t be released for some time.
The Atlanta Fed has run their model for several years and focuses predominantly on the “hard” data used to compute GDP. The New York Fed, on the other hand, uses an approach more heavily based in statistical forecasting and uses much more “soft” survey data, such as consumer sentiment and business optimism. In the first graph below note that NY Fed is predicting higher GDP growth than the Atlanta Fed. Since the quarter just ended, it seems likely that the Atlanta Fed model is closer to reality. The question going forward remains: Do the optimistic surveys forecast increased activity or will activity remained subdued, bringing sentiment down with it?

The Portfolio Change
As stated above, we have recently modified our portfolio allocations. Because the specifics of these changes are different portfolios for different risk levels, we’ll only discuss broad themes here. We have increased exposure to emerging markets and foreign currencies. In addition, we now have different portfolios for taxable and non-taxable accounts and have added municipal bonds to our taxable fixed income allocations.
We increased emerging markets exposure in most portfolios, either through equity or fixed income exposure. We can see in the first graph below that emerging market equity is currently trading at a lower Price / Earnings valuation than developed market equity. To be sure, this alone is not always a reason to buy. After all, sometimes things are cheap for a reason.
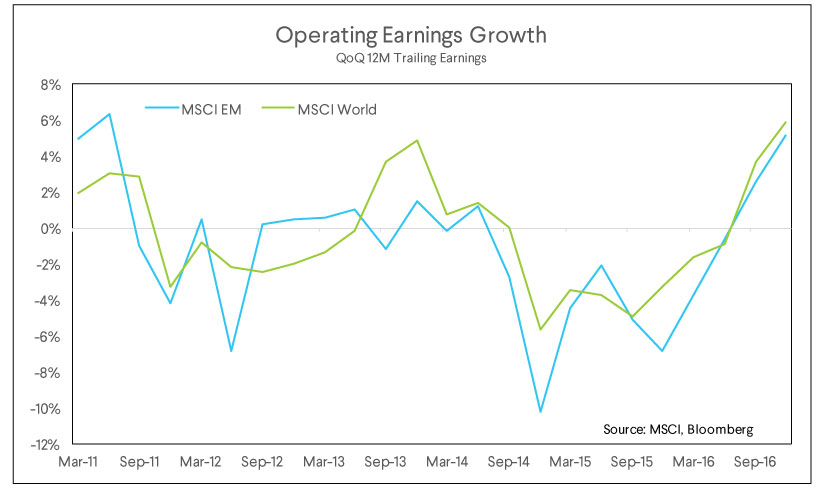
Why do we see value now? Note in the second graph below that for the first time in several years earnings growth in emerging markets is significantly positive. In addition, it looks set to overtake developed markets’ earnings growth as emerging markets are more sensitive to an accelerating international trade cycle.
Risks to strong EM outperformance remain present. A faster pace of Federal Reserve rate hikes could spell near term downside in emerging markets. Likewise, as a higher risk asset class it could be affected by conflict between the U.S. and other powers in the Middle East or Asia. More significantly, should the proposed Border Adjustment Tax (BAT) be signed into law, global trade could be affected and emerging markets might suffer disproportionally. We think on a longer-term basis the first two risks are less important, and the BAT unlikely to pass the Senate.

We have also assumed much more foreign exchange exposure than in recent portfolios. We were hedging currency exposure in developed international markets because the dollar had been appreciating. If you don’t hedge and the dollar appreciates against other currencies, your holdings of foreign stocks lose value in dollar terms. However, this hedging is not free and the ETFs that hedge currency exposure pass those fees on in the form of higher expense ratios. We now think that the case for paying for hedging is less compelling than it was a few months ago.

We can see in the chart above that the dollar’s real effective exchange rate (a measure of how expensive U.S. goods are relative to foreign goods) is at its highest level in over 30 years. Does this mean it goes straight down from here? Probably not, but it does make the case for a significantly higher dollar over the next 5 years less likely. After all, U.S. goods can only get so expensive before people stop buying them and instead look for domestic alternatives. In our view, the risk-reward tradeoff has moved back towards not hedging our currency exposure.
The SoFi Wealth Market Commentary does not provide individually tailored investment advice. It has been prepared without regard to the circumstances and objectives of those who receive it. We recommend that investors independently evaluate particular investments and strategies, and encourage investors to seek the advice of one of our financial advisors. The appropriateness of an investment or strategy will depend on an investor’s circumstances and objectives. This is not an offer to buy or sell any security/instrument or to participate in any trading strategy. The value of and income from your investments may vary because of changes in interest rates, foreign exchange rates, default rates, prepayment rates, securities/instruments prices market indexes, operational or financial conditions of companies or other factors. Past performance is not a guide to future performance. Estimates of future performance are based on assumptions that may not be realized.


All your finances.
All in one app.
App Store rating
![]()
![]()
Stay up to date on the latest business news and stock market happenings.