Record GAAP and Adjusted Revenue and 5th Consecutive Quarter of Positive Adjusted EBITDA
Total Year-over-Year Member Growth of 96% to 2.9 Million
Added 377,000 New Members, Second-Highest Quarterly Increase in Company History
Total Products Up 108% to 4.3 Million, 5th Consecutive Quarter of Year-over-Year Triple-Digit Growth
SoFi Money, SoFi Invest and SoFi Credit Card Drove 79% of New Member Growth and 73% of Cross-Buy
SAN FRANCISCO, Calif – (BUSINESS WIRE) – November 10, 2021 – SoFi Technologies, Inc. (NASDAQ: SOFI), a member-centric, one-stop shop for digital financial services that allows members to borrow, save, spend, invest and protect their money, reported financial results today for its third quarter ended September 30, 2021.
“I believe we’ve accomplished more at SoFi across our uniquely diversified platform of mobile-first financial services products over the past year than many other companies will achieve in a lifetime,” said Anthony Noto, CEO of SoFi Technologies, Inc. “Our strategy to build the first digital one-stop shop that meets our members’ financial needs for every major event in their lives, and all of the days in between, continues to pay off. Through successful execution, we’ve grown, broadened, and diversified our three business segments, resulting in another quarter of record revenue and a fifth consecutive quarter of positive EBITDA — even as the student lending environment remained depressed, and economic and market conditions remained volatile. The third quarter was our second-highest ever for both member and product growth. Total members grew 96% year-over-year, to 2.9 million, with 377,000 additions up 35% from 279,000 in the second quarter. Total products grew 108% year-over-year, to nearly 4.3 million, with 600,000 additions up 24% from 483,000 in the second quarter. And we continued to leverage our Financial Services Productivity Loop (FSPL) strategy, with SoFi Invest, SoFi Money and SoFi Credit Card first members driving 79% of our new member growth and 73% of cross-buy in the quarter.”
Noto continued: “We hit several new milestones across our businesses. Third quarter Lending revenue reached a new high, driven primarily by record funded volume and revenue in our personal loans business — a testament to our success over the past four years in diversifying this segment beyond Student Loan Refinancing, where volumes remain at less than half their pre-Covid levels. In Financial Services, our products, many of which are less than three years old, grew 179% year-over-year, to 3.2 million. In our Technology Platform segment, the 13 new clients we added brought our year-to-date total to 35, and we finished the quarter with 89 million client-enabled accounts, up 80% from the same prior-year quarter. We also completed both a comprehensive update of Galileo’s on-premise technology, and the build-out of a new cloud-based modern card issuing and payment platform, where we are now onboarding new clients. And as a company, SoFi exceeded $1 billion in annualized run-rate revenue and now has $4.6 billion in capital. In the last year, we have raised $3.6 billion, including $2.4 billion in a combined private financing led by T. Rowe Price, a PIPE and public listing, and $1.2 billion via a convertible debt offering at a 0% coupon in early October. In summary, the third quarter of 2021 capped a year-long sprint of great milestones, and we now have more flexibility than ever to execute and fund our long-term strategic growth plans and position SoFi as the ‘winner takes most’ in financial technology.”
Consolidated Results
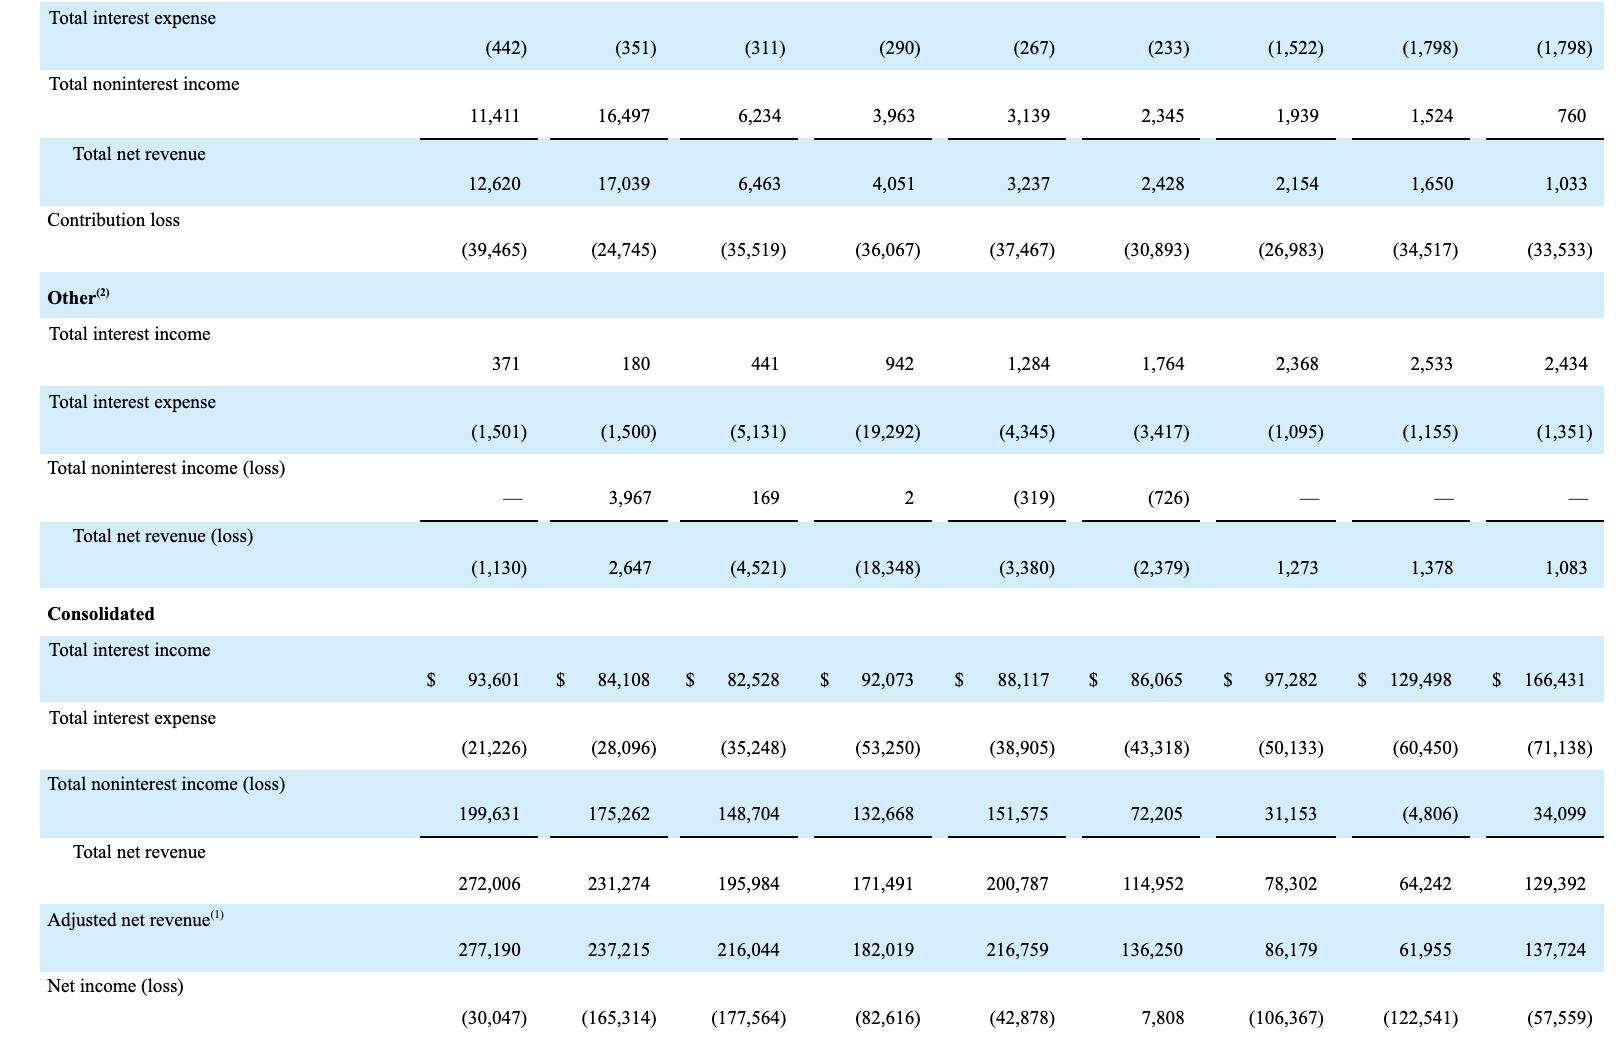
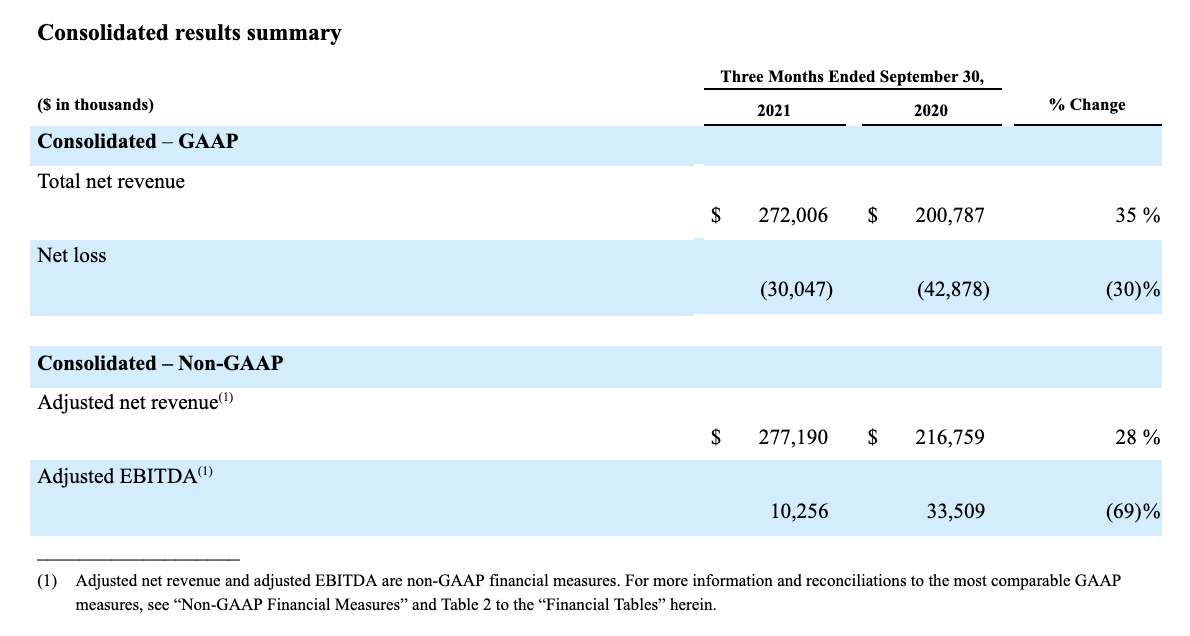
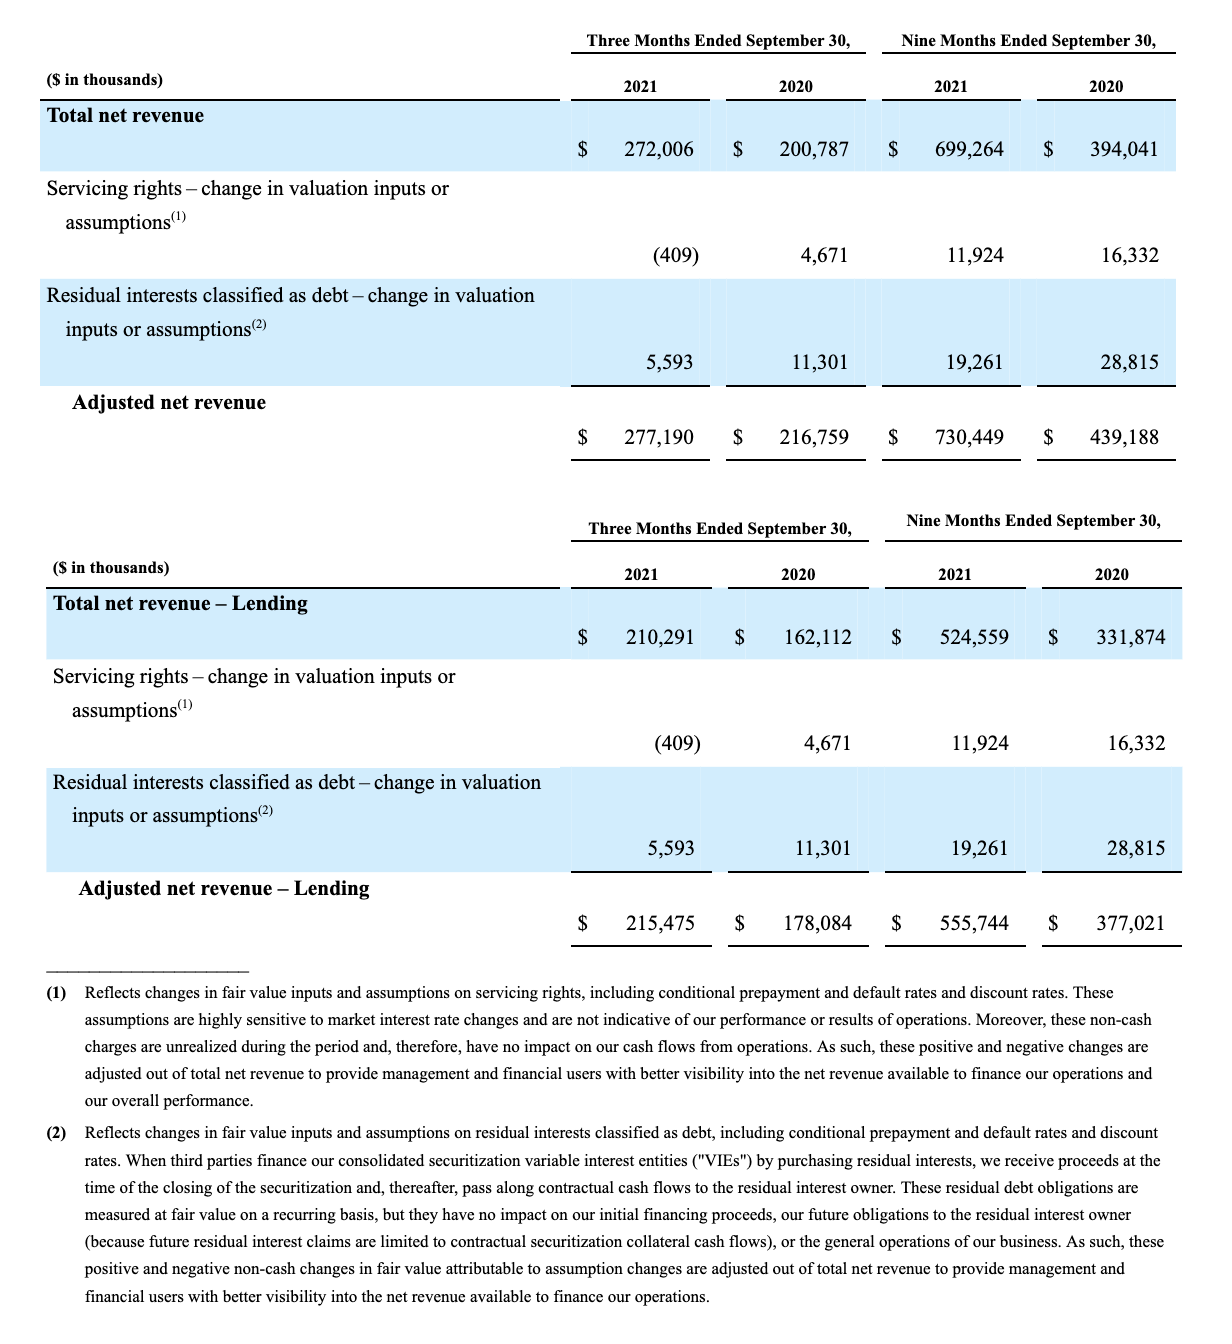
Total GAAP net revenue of $272.0 million in the third quarter of 2021 increased 35% from the same prior-year period. On an adjusted basis, net revenue for the third quarter of 2021 was $277.2 million, a record for us and 28% above last year’s third quarter total of $216.8 million. Strength in all three of SoFi’s business segments drove the growth in these measures.
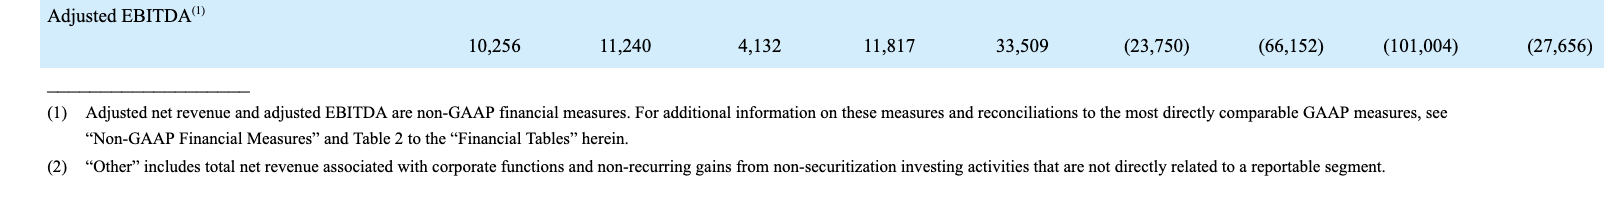
SoFi recorded a $30.0 million GAAP net loss for the third quarter of 2021, an improvement of nearly $13 million from last year’s third quarter net loss of $42.9 million. Third quarter adjusted EBITDA of $10.3 million was positive for the fifth consecutive quarter.
Member and Product Growth
Continued new product enhancements, together with more effective execution of our marketing, branding and FSPL strategies, drove another quarter of robust growth in both members and total products. As SoFi solidifies itself as a one-stop shop for digital financial products that meet all of our members’ financial needs throughout a lifetime, this creates a compounding effect on member referrals, greater adoption of multiple products and cost-efficient scaling of our broad-based offering. The efficiencies we gain through the FSPL allow us to invest more in new products and enhancements and better pricing, which completes the virtuous circle for SoFi and our members.
During the third quarter, we launched a series of marketing campaigns designed to increase SoFi’s brand awareness, members and products. The SoFi Money Moves brand campaign we debuted during the US Open tennis tournament in September and the regular NFL season has significantly raised SoFi’s profile. This campaign includes an integrated, cross-platform, multi-channel marketing program that leverages nationally televised NFL games and events at SoFi Stadium, our most comprehensive digital influencer program to date, a SoFi Money Moves social video contest on TikTok, and a new referral program.
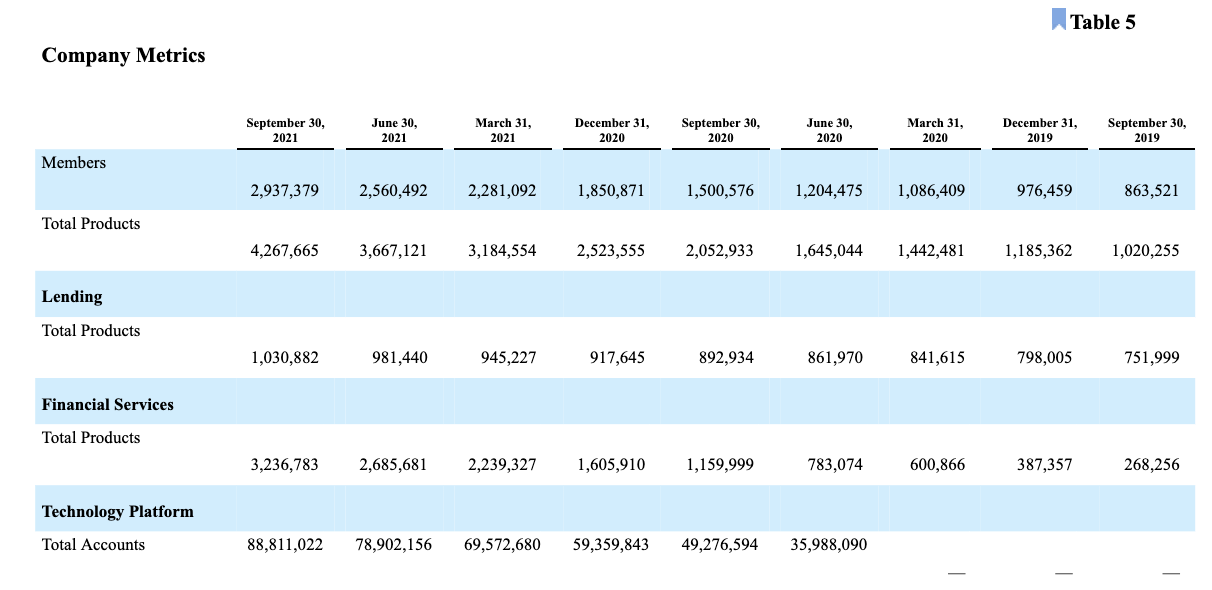
Total members grew 96% year-over-year to 2.9 million, from 1.5 million. This marked SoFi’s second largest quarter of new member additions at approximately 377,000, and a 35% increase from the approximately 279,000 new members added in the second quarter.
Total products more than doubled year-over-year, to 4.3 million from 2.1 million, representing SoFi’s fifth consecutive quarter of triple-digit annual growth. We added approximately 600,000 new products, which was our second-highest quarterly total ever, and up 24% from approximately 483,000 new products added in the prior quarter. As important, our sequential product growth exceeded our member growth in absolute terms in the third quarter, indicating high product satisfaction and greater willingness to adopt additional products, further reinforcing the value of our FSPL strategy.


In the Financial Services segment, growth of SoFi Invest and SoFi Money offerings primarily drove the 179% year-over-year product increase in the segment, to more than 3.2 million from 1.2 million. At quarter end, total Financial Services segment products were more than triple the number of Lending products.
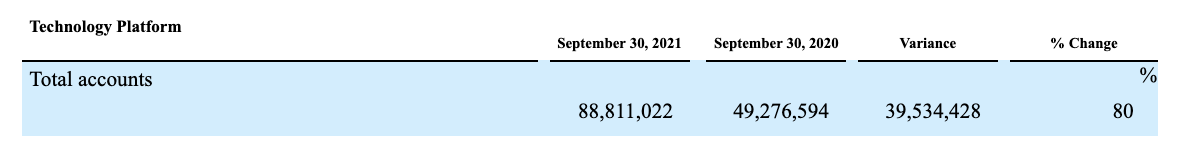
Lending products rose across all loan types year-over-year in the third quarter, with personal and student loans the largest drivers of the overall 15% increase. Technology Platform accounts increased by 80% year-over-year in the third quarter of 2021, to nearly 89 million, due to both diverse new client additions and growth among existing Galileo clients.
Specific milestones achieved through our integrated marketing, product and FSPL efforts include:
SoFi Money Moves Brand and Influencer Campaign:
⦁ SoFi unaided brand awareness more than doubled to a new high during the Money Moves campaign launch week.
⦁ TV spots drove more than 500 million impressions during some of the biggest moments in fall sports, and nationally televised games from SoFi Stadium averaged more than 20 million TV viewers per game.
⦁ By working with the biggest digital influencers across YouTube, Twitter, Instagram and TikTok, we drove an additional 400 million impressions and 775,000 engagements with SoFi content.
⦁ Our hashtag challenge campaign #SOFIMONEYMOVES on TikTok drove more than 8 billion views and more than one million uses of our branded hashtag.
Product, Cross-Buy, Referrals and Rewards:
⦁ The third quarter was SoFi’s highest ever for cross-buying of products by existing members.
⦁ By iterating on referrals, continuing to scale top of the funnel products, and expanding our popular SoFi Personal Loans – SoFi Money bundle to 100% of our members, we drove a 65% sequential increase in cross-buy volume among SoFi Money-first members.
⦁ The success of our new and enhanced referral programs, including Refer the App and the SoFi Money referral, drove an increase in member growth from referrals to 18% in the quarter, up from 3% in the second quarter.
⦁ SoFi Rewards – the only rewards program that allows members to earn points for both transactions and responsible financial behaviors – drove 15% of the quarter’s new product growth, up from 9% in the second quarter.
Lending Segment Results
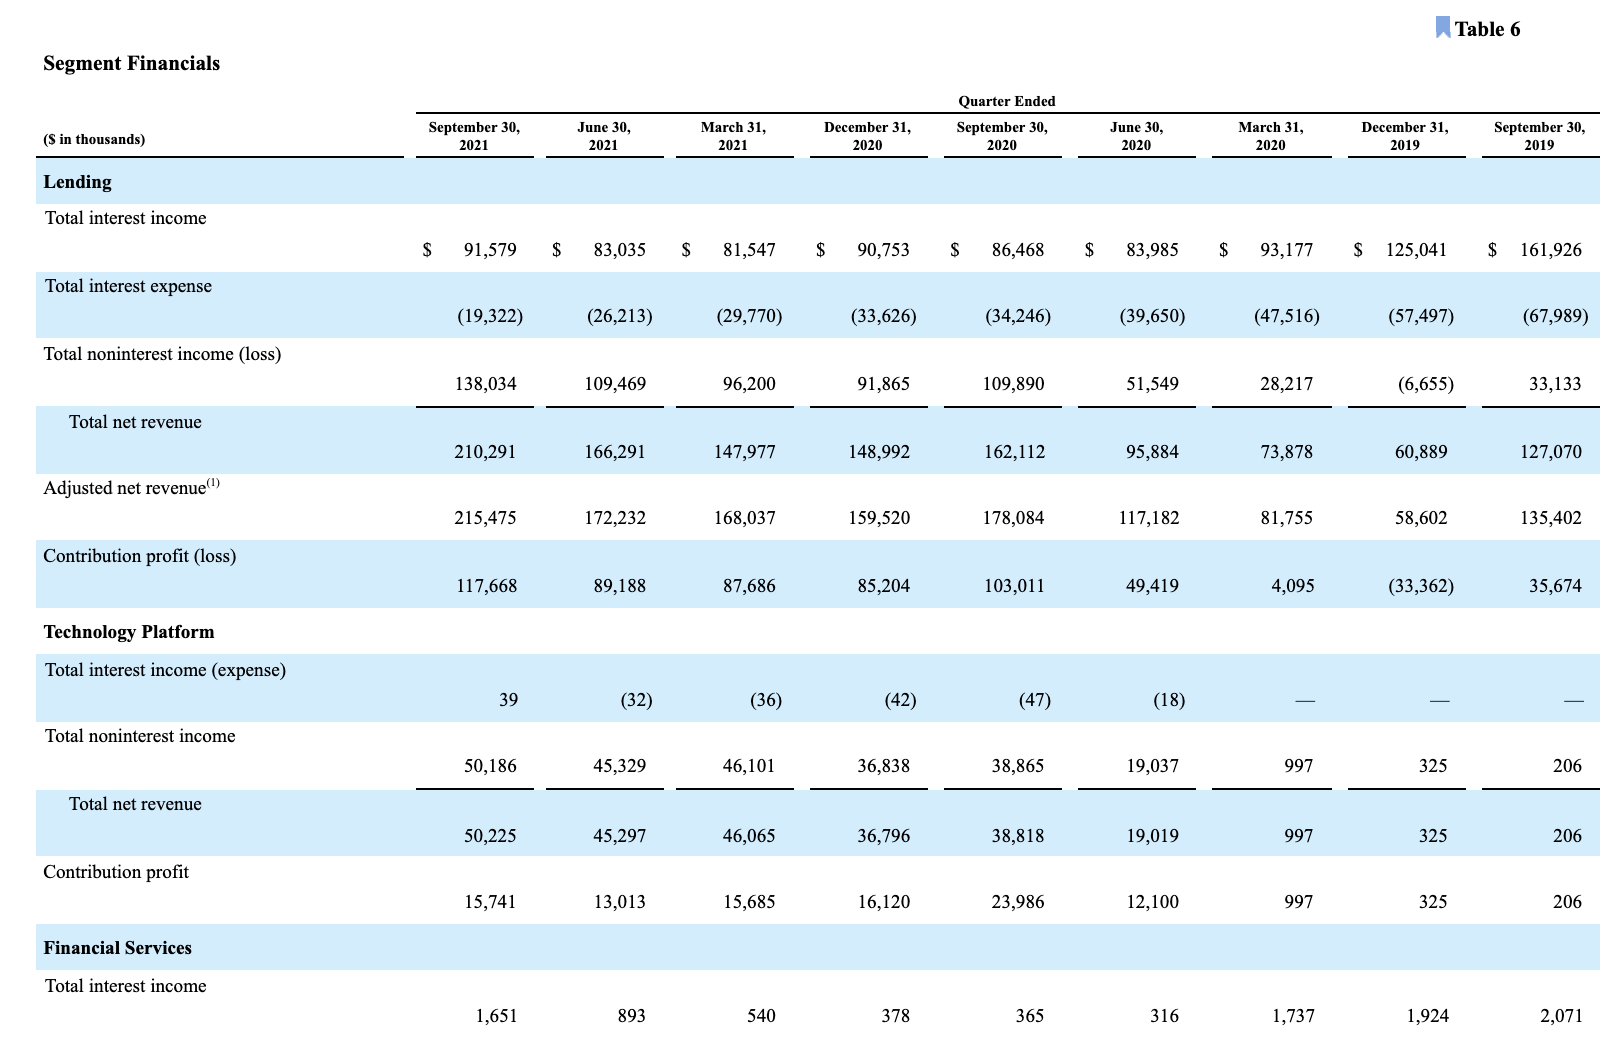
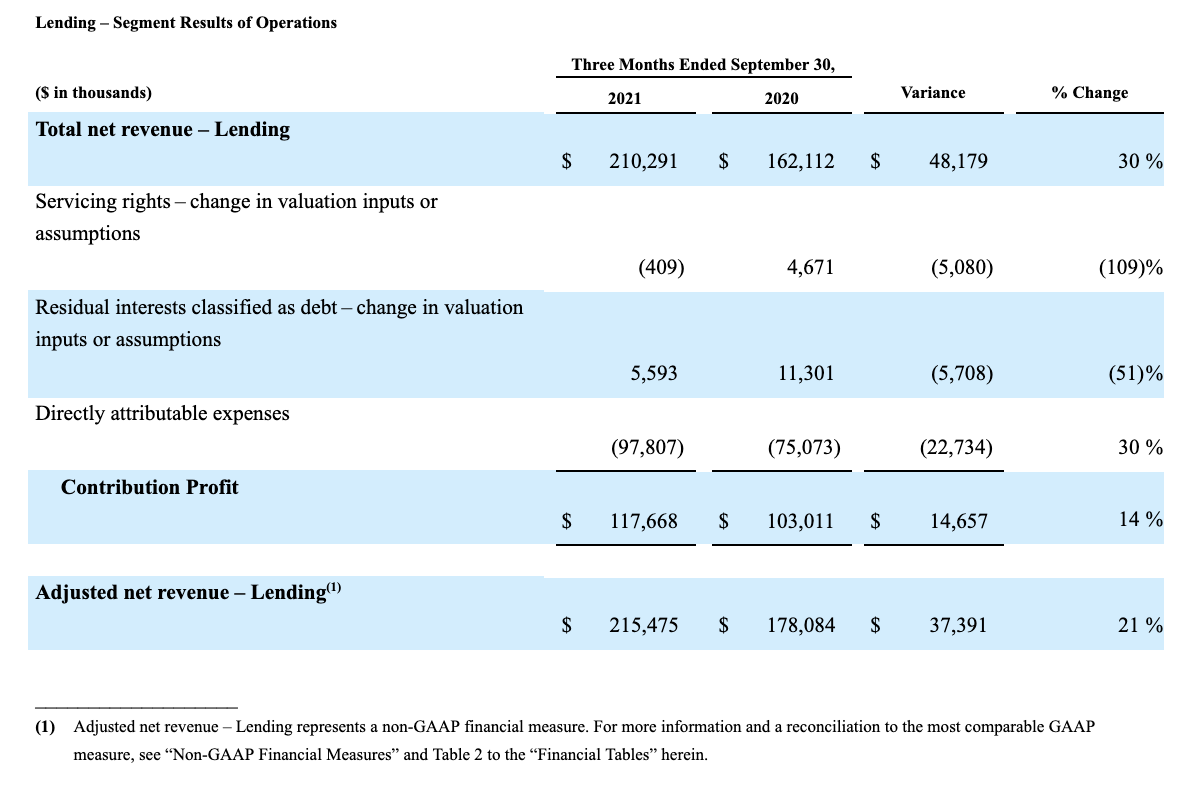
Lending segment net revenues reached an all-time high on both a GAAP and an adjusted basis, at $210.3 million and $215.5 million, respectively, for the third quarter of 2021. This represented year-over-year increases of 30% and 21%, respectively, driven by growth in net interest income, and origination and gain on sale revenue.
Lending segment contribution profit of $117.7 million increased 14% year-over-year in the third quarter of 2021, with strength in personal loans the largest driver.
Third quarter Lending segment total origination volume increased 49% year-over-year. Record volume in both personal and home loans, which were up 166% and 26%, respectively, more than offset the decline in student loan volume, which remains depressed by the extension through January 2022 of the CARES Act moratorium on federal student loan payments.
Record personal loan originations of more than $1.6 billion increased by $1 billion year-over-year. With rates on the rise, we benefited from SoFi’s ability to leverage our testing and iterating platforms and capabilities across pricing, credit and marketing. We successfully captured increased demand from personal loan borrowers looking to remodel homes or refinance out of variable-rate debt into our attractive fixed-rate term products. Our 166% growth in personal loans reflects years of investing to penetrate the very attractive prime target, where our average FICO score of 749 for the quarter remains near all-time highs.

SoFi also continues to compete effectively with our Rate Match Guarantee feature, which was introduced in the second quarter and further scaled during the third quarter. As important, we achieved record high personal loan NPS scores, approval and automation rates, as well as record low time-to-fund rates, even as funding volume and revenue hit new highs. Automation enhancements are a significant driver of member satisfaction: today, 70% of SoFi personal loans are “no touch” on income verification — and we keep iterating to drive that number even higher. And in home loans, we progressed further in our efforts to transition into the purchase side of the business through new, high-quality lead generation partnerships.

Technology Platform Segment results
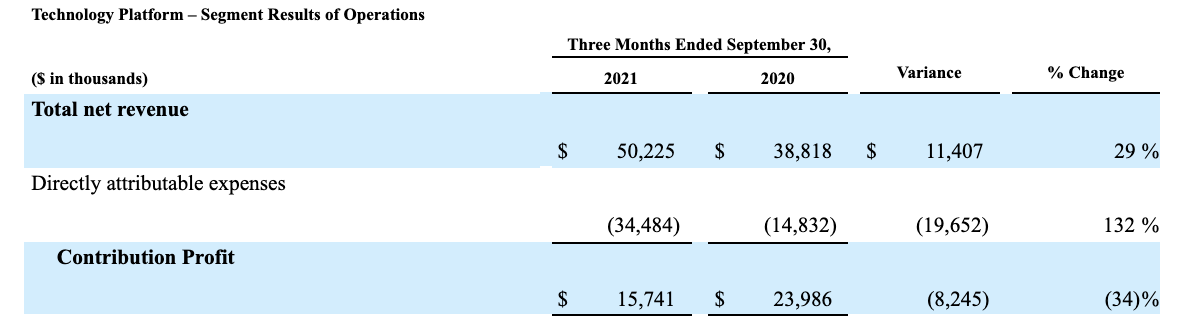
SoFi’s Technology Platform segment consists primarily of Galileo Financial Technologies, LLC (Galileo), a technology infrastructure provider we acquired in May 2020. Already a leader in the internet-only neobank space, Galileo continues to expand into new client segments, while adding to its suite of product offerings. Galileo signed 13 new clients during the quarter, bringing the year-to-date total to 35. Client accounts enabled by Galileo rose by 80% year-over-year in the third quarter, to nearly 89 million from 49 million, through new client acquisition and growth at existing clients.
Technology Platform segment net revenue of $50.2 million for the third quarter of 2021 was up 29% compared to the prior year period, when we benefited from the government stimulus. We remain committed to positioning Galileo to capture the secular transition of physical payments to digital payments and the accelerating need for diverse fintech services in order to deliver durable, long-term compounding growth, and will continue to invest accordingly. This increased investment drove Galileo operating expenses 132% higher year-over-year and lowered the contribution margin from above 60% to 31% in the quarter. Maintaining this high level of investment for sustained, long-term growth will entail operating the business at a 20–30% margin range.
Financial Services Segment results
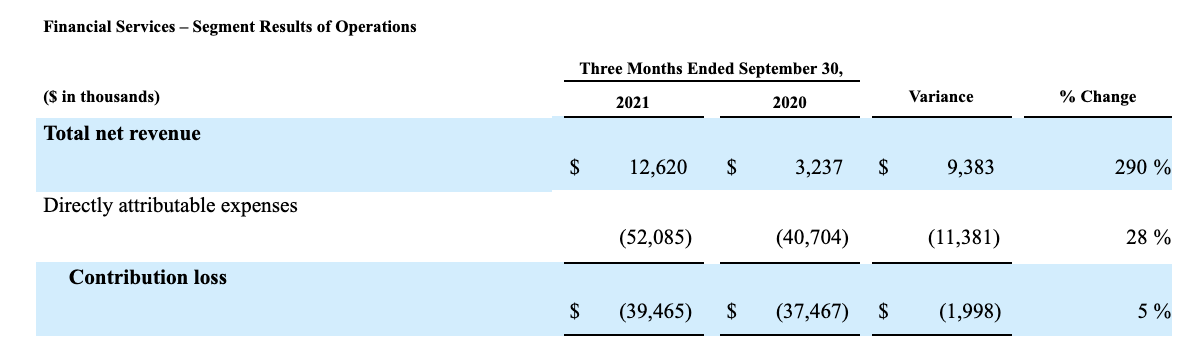
Our Financial Services segment continues to benefit from significant growth in each product in our diverse suite of offerings. While we remain in investment mode to drive long-term, compounding growth, the scale we are achieving in members and products is beginning to contribute to overall company revenues. As important, we are maintaining this high level of investment while at the same time improving the unit economics across the segment.
Third quarter 2021 net revenue of $12.6 million was nearly quadruple the third quarter 2020 total of $3.2 million. The Financial Services segment contribution loss of $39.5 million increased by $2.0 million from the prior year quarter loss of $37.5 million due to the ongoing investments made to grow this business.
By continuously innovating for members with new and relevant offerings, features and rewards, SoFi has added more than two million Financial Services products in the past year, to 3.2 million in total. In SoFi Invest, new offerings introduced during the quarter include seven new cryptocurrencies, extended hours quotes and a performance graph pilot. We also earned recognition for our growing Robo-Advisory business from Barron’s, which just named SoFi the “Best Robo-Advisor” for 2021. Triple-digit growth in SoFi Money and SoFi Invest products were the largest drivers of our 179% year-over-year increase in total Financial Services products. We also made multiple enhancements to the SoFi Credit Card across product, credit policy, marketing and affiliate optimization, which drove strong growth in account holders, spend and balances in the quarter.

Convertible Debt Offering
On September 29, 2021, SoFi Technologies, Inc. announced that it priced a private offering of 0.00% convertible senior notes due 2026 and increased the aggregate principal amount of the offering to $1.2 billion. The issuance and sale of the notes settled on October 4, 2021.
SoFi Technologies, Inc. Warrants Redemption
On November 4, 2021, SoFi Technologies, Inc. announced that it will redeem all of its outstanding Public Warrants that were issued under the Warrant Agreement, dated October 8, 2020, by and between the Company and Continental Stock Transfer & Trust Company, as warrant agent, (the “Warrant Agreement”), as part of the units sold in the initial public offering (the “IPO”) of Social Capital Hedosophia Holding Corp. V (“SCH”), as well as all of its outstanding Private Warrants to purchase Common Stock that were issued under the Warrant Agreement in a private placement simultaneously with the IPO, and that remain outstanding at 5:00 p.m. New York City time on December 6, 2021 (the “Redemption Date”), for a redemption price of $0.10 per Warrant. Social Finance, LLC completed a business combination with SCH on May 28, 2021, in connection with which SCH was renamed SoFi Technologies, Inc.
The Warrants may be exercised by the holders thereof until 5:00 p.m. New York City time on the Redemption Date to purchase fully paid and non-assessable shares of Common Stock underlying such Warrants. As the Reference Value is less than $18.00 per share, payment upon exercise of the Warrants may be made either (i) in cash, at an exercise price of $11.50 per share of Common Stock or (ii) on a “cashless basis” in which the exercising holder will receive a number of shares of Common Stock to be determined in accordance with the terms of the Warrant Agreement and based on the Redemption Date and the volume weighted average price (the “Fair Market Value”) of the Common Stock during the 10 trading days immediately following the date on which the notice of redemption was sent to holders of Warrants. The Company will provide holders the Fair Market Value no later than one business day after such 10-trading day period ends. In no event will the number of shares of Common Stock issued in connection with an exercise on a cashless basis exceed 0.361 shares of Common Stock per Warrant. If any holder of Warrants would, after taking into account all of such holder’s Warrants exercised at one time, be entitled to receive a fractional interest in a share of Common Stock, the number of shares the holder will be entitled to receive will be rounded down to the nearest whole number of shares.
Any Warrants that remain unexercised at 5:00 p.m. New York City time on the Redemption Date will be void and no longer exercisable, and the holders of those Warrants will be entitled to receive only the redemption price of $0.10 per Warrant.
Guidance and Outlook
Third quarter 2021 adjusted net revenue of $277 million exceeded quarterly guidance of $245 million to $255 million by 13% at the low end and 9% at the high end. Adjusted EBITDA of $10 million for the quarter exceeded quarterly guidance of $(7) million to $3 million by $17 million at the low end and $7 million at the high end.
Management expects an acceleration of annual growth in the fourth quarter of 2021, with expected adjusted net revenue of $272 million to $282 million, up 49–55% year-over-year, versus 28% year-over-year growth in the third quarter, and expected adjusted EBITDA of $2 million to $5 million.
Management now expects to exceed its original guidance, with full-year adjusted net revenue of $1.002 billion to $1.012 billion and full-year adjusted EBITDA of $28 million to $31 million. Management will further address fourth quarter and full-year 2021 guidance on the quarterly earnings conference call.
Earnings Webcast
SoFi’s executive management team will host a live audio webcast beginning at 5:00 p.m. Eastern Time (2:00 p.m. Pacific Time) today to discuss the quarter’s financial results and business highlights. All interested parties are invited to listen to the live webcast at https://investors.sofi.com. A replay of the webcast will be available on the SoFi Investor Relations website for 30 days. Investor information, including supplemental financial information, is available on SoFi’s Investor Relations website at https://investors.sofi.com
Cautionary Statement Regarding Forward-Looking Statements
Certain of the statements above are forward-looking and as such are not historical facts. This includes, without limitation, statements regarding the financial position, business strategy and the plans and objectives of management for our future operations. These forward-looking statements are not guarantees of performance. Such statements can be identified by the fact that they do not relate strictly to historical or current facts. Words such as “anticipate”, “believe”, “continue”, “could”, “estimate”, “expect”, “intend”, “may”, “opportunity”, “future”, “strategy”, “might”, “plan”, “possible”, “potential”, “predict”, “project”, “should”, “strive”, “would”, “will be”, “will continue”, “will likely result” and similar expressions may identify forward-looking statements, but the absence of these words does not mean that a statement is not forward-looking. Factors that could cause actual results to differ materially from those contemplated by these forward-looking statements include: (i) the effect of and uncertainties related to the COVID-19 pandemic (including any government responses thereto); (ii) our ability to achieve and maintain profitability in the future; (iii) the impact on our business of the regulatory environment and complexities with compliance related to such environment; (iv) our ability to become a bank holding company and acquire a national bank charter; (v) our ability to respond to general economic conditions; (vi) our ability to manage our growth effectively and our expectations regarding the development and expansion of our business; (vii) our ability to access sources of capital, including debt financing and other sources of capital to finance operations and growth; (viii) the success of our continued investments in our Financial Services segment and in our business generally; (ix) the success of our marketing efforts and our ability to expand our member base; (x) our ability to maintain our leadership position in certain categories of our business and to grow market share in existing markets or any new markets we may enter; (xi) our ability to develop new products, features and functionality that are competitive and meet market needs; (xii) our ability to realize the benefits of our strategy, including what we refer to as our financial services productivity loop; (xiii) our ability to make accurate credit and pricing decisions or effectively forecast our loss rates; (xiv) our ability to establish and maintain an effective system of internal controls over financial reporting; (xv) our ability to maintain the listing of our securities on Nasdaq; (xvi) our ability to realize the anticipated benefits of the Business Combination; and (xvii) the outcome of any legal or governmental proceedings that may be instituted against us. The foregoing list of factors is not exhaustive. You should carefully consider the foregoing factors and the other risks and uncertainties set forth in the section titled “Risk Factors” in the final proxy/prospectus for our recently completed Business Combination, as filed with the Securities and Exchange Commission, and those that are included in any of our future filings with the Securities and Exchange Commission, including our periodic reports under the Exchange Act.
These forward-looking statements are based on information available as of the date hereof and current expectations, forecasts and assumptions, and involve a number of judgments, risks and uncertainties. Accordingly, forward-looking statements should not be relied upon as representing our views as of any subsequent date, and we do not undertake any obligation to update forward-looking statements to reflect events or circumstances after the date they were made, whether as a result of new information, future events or otherwise, except as may be required under applicable securities laws.
As a result of a number of known and unknown risks and uncertainties, our actual results or performance may be materially different from those expressed or implied by these forward-looking statements. You should not place undue reliance on these forward-looking statements.
Non-GAAP Financial Measures
This press release presents information about our adjusted net revenue and adjusted EBITDA, which are non-GAAP financial measures provided as supplements to the results provided in accordance with accounting principles generally accepted in the United States (GAAP). We use adjusted net revenue and adjusted EBITDA to evaluate our operating performance, formulate business plans, help better assess our overall liquidity position, and make strategic decisions, including those relating to operating expenses and the allocation of internal resources. Accordingly, we believe that adjusted net revenue and adjusted EBITDA provide useful information to investors and others in understanding and evaluating our operating results in the same manner as our management. These non-GAAP measures are presented for supplemental informational purposes only, have limitations as analytical tools, and should not be considered in isolation from, or as a substitute for, the analysis of other GAAP financial measures, such as total net revenue and net income (loss). Other companies may not use these non-GAAP measures or may use similar measures that are defined in a different manner. Therefore, SoFi’s non-GAAP measures may not be directly comparable to similarly titled measures of other companies. Reconciliations of these non-GAAP measures to the most directly comparable GAAP financial measures are provided in Table 2 to the “Financial Tables” herein.
Forward-looking non-GAAP financial measures are presented without reconciliations of such forward-looking non-GAAP measures because the GAAP financial measures are not accessible on a forward-looking basis and reconciling information is not available without unreasonable effort due to the inherent difficulty in forecasting and quantifying certain amounts that are necessary for such reconciliations, including adjustments reflected in our reconciliation of historic non-GAAP financial measures, the amounts of which, based on historical experience, could be material.
About SoFi
SoFi’s mission is to help people achieve financial independence to realize their ambitions. Our products for borrowing, saving, spending, investing and protecting give our more than two million members fast access to tools to get their money right. SoFi membership comes with the key essentials for getting ahead, including career advisors and connection to a thriving community of like-minded, ambitious people. SoFi is also the naming rights partner of SoFi Stadium, home of the Los Angeles Chargers and the Los Angeles Rams. For more information, visit https://www.sofi.com or download our iOS and Android apps.
Availability of Other Information About SoFi
Investors and others should note that we communicate with our investors and the public using our website (www.sofi.com), the investor relations website (https://investors.sofi.com), and on social media (Twitter and LinkedIn), including but not limited to investor presentations and investor fact sheets, Securities and Exchange Commission filings, press releases, public conference calls and webcasts. The information that SoFi posts on these channels and websites could be deemed to be material information. As a result, SoFi encourages investors, the media, and others interested in SoFi to review the information that is posted on these channels, including the investor relations website, on a regular basis. This list of channels may be updated from time to time on SoFi’s investor relations website and may include additional social media channels. The contents of SoFi’s website or these channels, or any other website that may be accessed from its website or these channels, shall not be deemed incorporated by reference in any filing under the Securities Act of 1933, as amended.
Contact
Investors:
Andrea Prochniak
SoFi Investor Relations
[email protected]
Media:
Rachel Rosenzweig
SoFi Media Relations
[email protected]
FINANCIAL TABLES
1. Condensed Consolidated Statements of Operations and Comprehensive Loss (unaudited)
2. Reconciliation of GAAP to Non-GAAP Financial Measures
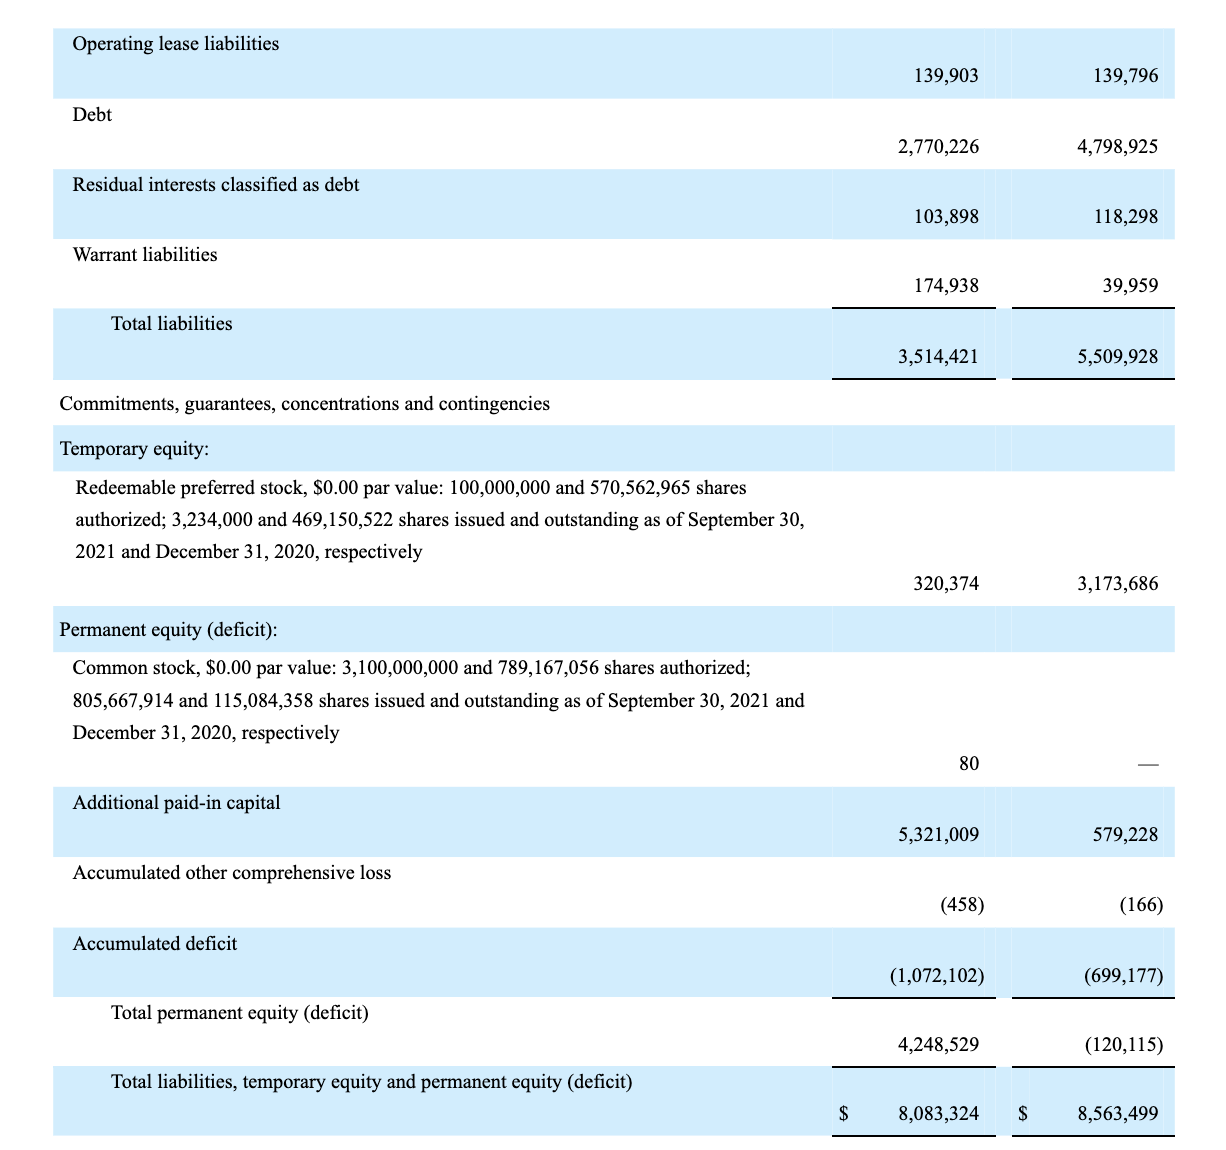
3. Condensed Consolidated Balance Sheets (unaudited)
4. Condensed Consolidated Statements of Cash Flows (unaudited)
5. Company Metrics
6. Segment Financials


Non-GAAP Financial Measures
Reconciliation of Adjusted Net Revenue
Adjusted net revenue is defined as total net revenue, adjusted to exclude the fair value changes in servicing rights and residual interests classified as debt due to valuation inputs and assumptions changes, which relate only to our Lending segment. For our consolidated results and for the Lending segment, we reconcile adjusted net revenue to total net revenue, the most directly comparable GAAP measure, as presented for the periods indicated below:
Table 2
Reconciliation of Adjusted EBITDA
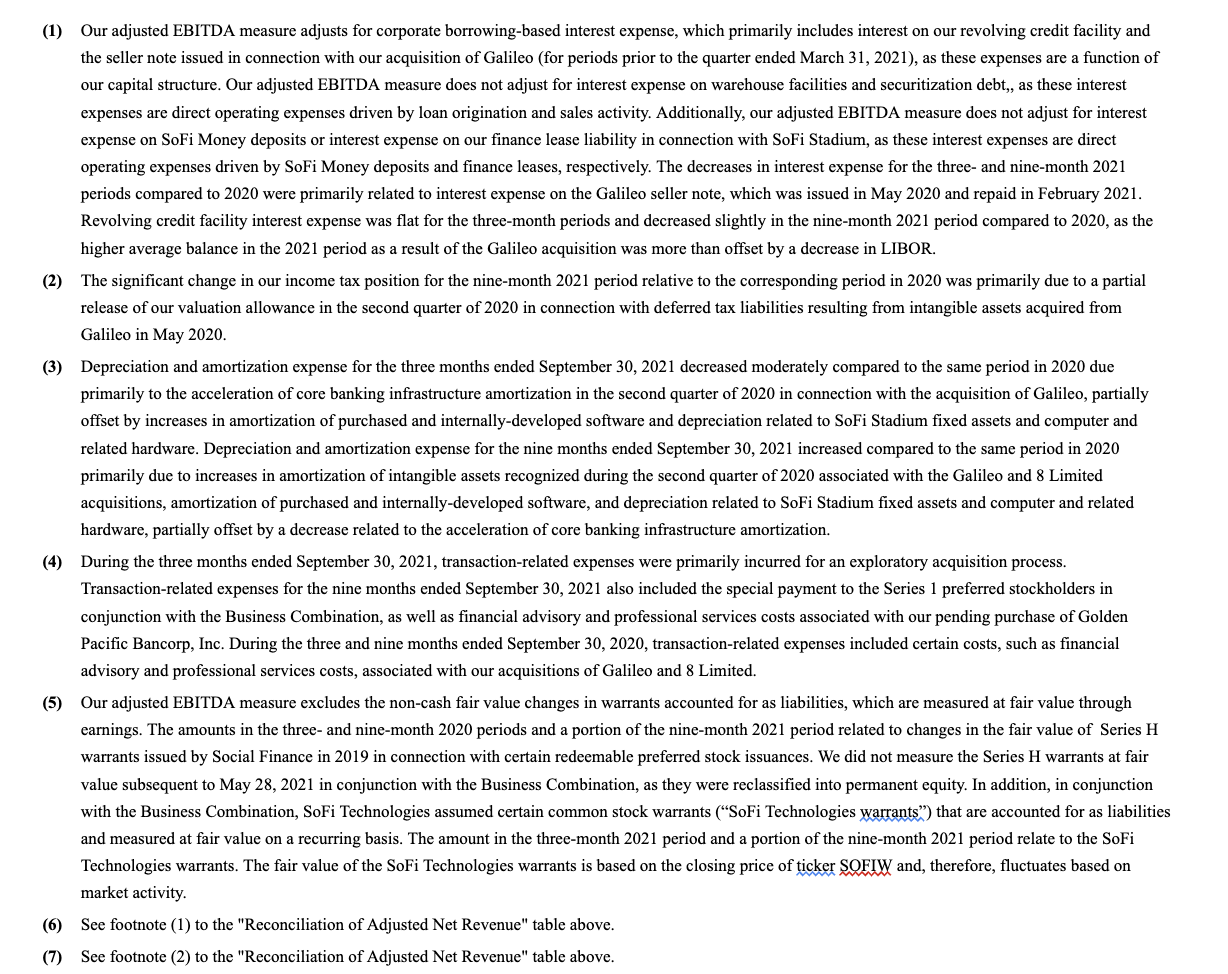
Adjusted EBITDA is defined as net income (loss), adjusted to exclude: (i) corporate borrowing-based interest expense (our adjusted EBITDA measure is not adjusted for warehouse or securitization-based interest expense, nor deposit interest expense and finance lease liability interest expense, as discussed further below), (ii) income taxes, (iii) depreciation and amortization, (iv) stock-based expense (inclusive of equity-based payments to non-employees), (v) impairment expense (inclusive of goodwill impairment and property, equipment and software abandonments), (vi) transaction-related expenses, (vii) warrant fair value adjustments, and (viii) fair value changes in servicing rights and residual interests classified as debt due to valuation assumptions. We reconcile adjusted EBITDA to net income (loss), the most directly comparable GAAP measure, for the periods indicated below:


Members
We refer to our customers as “members”. We define a member as someone who has had a lending relationship with us through origination or servicing, opened a financial services account, linked an external account to our platform, or signed up for our credit score monitoring service. Once someone becomes a member, they are always considered a member unless they violate our terms of service, given that our members have continuous access to our certified financial planners, our career advice services, our member events, our content, educational material, news, tools and calculators at no cost to the member. We view members as an indication not only of the size and a measurement of growth of our business, but also as a measure of the significant value of the data we have collected over time.
Products
Total products refers to the aggregate number of lending and financial services products that our members have selected on our platform since our inception through the reporting date, whether or not the members are still registered for such products. In our Lending segment, total products refers to the number of home loans, personal loans and student loans that have been originated through our platform through the reporting date, whether or not such loans have been paid off. If a member has multiple loan products of the same loan product type, such as two personal loans, that is counted as a single product. However, if a member has multiple loan products across loan product types, such as one personal loan and one home loan, that is counted as two products. In our Financial Services segment, total products refers to the number of SoFi Money accounts, SoFi Invest accounts, SoFi Credit Card accounts (including accounts with a zero dollar balance at the reporting date), SoFi At Work accounts and SoFi Relay accounts (with either credit score monitoring enabled or external linked accounts) that have been opened through our platform through the reporting date. Our SoFi Invest service is composed of three products: active investing accounts, robo-advisory accounts and cryptocurrency accounts. Our members can select any one or combination of the three types of SoFi Invest products. If a member has multiple SoFi Invest products of the same account type, such as two active investing accounts, that is counted as a single product. However, if a member has multiple SoFi Invest products across account types, such as one active investing account and one robo-advisory account, those separate account types are considered separate products. Total products is a primary indicator of the size and reach of our Lending and Financial Services segments. Management relies on total products metrics to understand the effectiveness of our member acquisition efforts and to gauge the propensity for members to use more than one product.
Technology Platform Total Accounts
In our Technology Platform segment, total accounts refers to the number of open accounts at Galileo as of the reporting date, excluding SoFi accounts. We exclude SoFi accounts because revenue generated by Galileo from the SoFi relationship is eliminated in consolidation. No information is reported prior to our acquisition of Galileo on May 14, 2020. Total accounts is a primary indicator of the accounts dependent upon Galileo’s technology platform to use virtual card products, virtual wallets, make peer-to-peer and bank-to-bank transfers, receive early paychecks, separate savings from spending balances, make debit transactions and rely upon real-time authorizations, all of which result in technology platform fees for the Technology Platform segment.