
Editor's Note: Options are not suitable for all investors. Options involve risks, including substantial risk of loss and the possibility an investor may lose the entire amount invested in a short period of time. Please see the Characteristics and Risks of Standardized Options.
Table of Contents
Candlestick charts are one of many popular tools used for technical stock analysis. They are also called Japanese candlestick charts or patterns, because they were first invented in Japan in the 1700s to track the prices of rice. Today, candlestick patterns are used to reveal potential patterns in stock price movements.
Candlestick charts are one of multiple types of technical tools that traders use to analyze stock prices. There are some general patterns that are helpful to know and understand if you’re using candlestick charts while trading.
Key Points
• Candlestick patterns show sequences of price changes, which may help assess stock price movements.
• The use of candlestick patterns originated in 18th-century Japan, as a way to anticipate price trends and reversals.
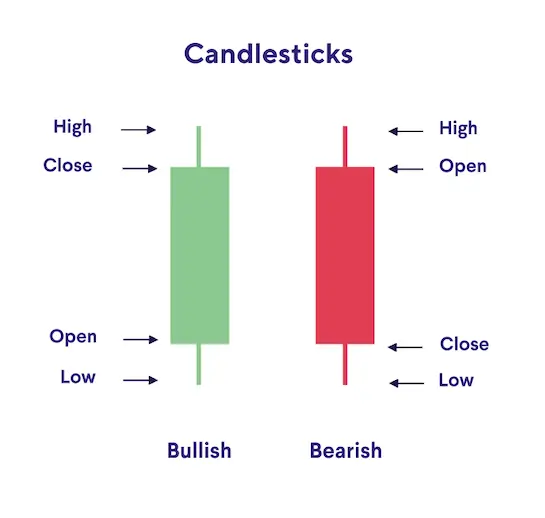
• The rectangular body of the candle represents a stock’s opening and closing prices; the wicks (or shadows) represent the high and low of the time period.
• The color of a candlestick (green, white, red, or black) is a visual snapshot of the price direction, whether bullish or bearish.
• There are many candlestick patterns that traders use to identify specific trends.
• Candlestick charts can’t predict price movements, rather they are one of many technical tools traders use in combination to anticipate trends.
What Is a Candlestick Pattern?
A candlestick pattern is a sequence of price changes that are represented as a series of candle-like formations on a chart. Each candlestick represents stock price increases or decreases within a specified time frame.
Watching out for particular candlestick patterns in charts is a popular day trading strategy, one that may help traders assess whether a stock may go up or down in value, and to make trades based on those predictions.
Again, this is a form of technical analysis, as opposed to fundamental stock analysis, which is different.
Candlestick patterns can be useful for helping some traders assess entry and exit timing for trades, when investing online or through a brokerage. Based on how stock price movements have repeatedly occurred in the past, traders may decide whether to put faith in them potentially moving in a similar way again. The reason these patterns form is that human perceptions, actions, and reactions to stock price movements also tend to be repeated.
Past events are not predictions of the future, however, and there are always risks when trading stocks. But candlestick patterns can be useful guidelines and one more piece of information for those looking to make informed trading decisions.
History and Origins of Candlestick Charts
Candlestick charts originated in 18th-century Japan, where a rice trader named Munehisa Homma developed a system to track rice prices and market sentiment. Homma’s techniques combined price patterns with observations about trader psychology, laying the groundwork for modern candlestick analysis.
While the system evolved over time, it was introduced to Western markets in the late 20th century. Today, candlestick charts are widely used across financial markets by day traders and other investors to assess short-term price movements and spot potential reversals or continuation patterns.
Recommended: Stock Trading Basics
Reading Single Candlesticks
Even a single candlestick on a candlestick chart can provide insight into where stock prices may head. Each candlestick is composed of four parts:
• Body. The body, or real body, is the rectangular candle-like shape that represents the opening and closing prices. A short body tends to indicate lack of a strong trading direction; a longer body suggests strong selling or buying pressure.
• Wicks. The top “wick” or shadow of a candlestick marks the highest price the stock traded within the specified time period. The bottom wick marks the lowest price the stock traded.
If a candlestick wick is long, this means the highest or lowest trading price is significantly different from the opening or closing price. A shorter wick can indicate that the high or low trade was close to the opening or closing price. The difference between the high and low price of the candlestick wicks is called the range.
• Candlestick color. The color provides a quick take on the price direction. A green or white candlestick body is bullish, with the closing price at the top, indicating it’s higher than the opening price. A red or black body is bearish, and reflects a lower closing price (at the bottom) vs. the opening, signaling potential downward pressure.
Candlesticks can represent different time frames. One popular time frame when stock trading is a single day, so each candlestick on a chart will show the price change for one day. A one-month chart would have approximately 30 candlesticks.
Trending Candles vs Non-Trending Candles
If a candle continues an ongoing price trend, this is called a trending candle. Candles that go against the trend are non-trending candles.
Candles that don’t have an upper or lower wick may also show that there is a strong trend, or support or resistance in either direction. This means the opening or closing price was close to the high or low trade. And vice versa — a long wick can be an indicator that the stock’s intraday high or low prices may not hold.
Doji Candles
When a candle’s opening and closing price are almost the same, this forms a doji candle, which looks like a cross or plus sign. The wicks of doji candles can vary in length.
A doji can either be a sign of a reversal or a continuation. It shows roughly equal forces from buyers and sellers, with little net price movement in either direction.
Long Shadow Candles
Candles with a long wick or shadow may indicate a rejection of higher or lower prices. A candle with a long upper shadow can signal seller rejection of higher prices, while a long lower shadow can signal buyer rejection of lower prices.
Marubozu Candles
A Marubozu candle is a single candlestick pattern that has no upper or lower wicks, showing only the real body. It may indicate that buying or selling pressure was especially strong during the selected time period.
A green Marubozu may suggest steady upward pressure, while a red Marubozu might point to consistent downward pressure. Traders sometimes view Marubozu candles as potential signals that prevailing trends could continue.
Recommended: Implied Volatility: What It Is & What It’s Used for
Types of Candlestick Patterns
Candlestick patterns are used to help analyze stock price action. There are dozens of candlestick patterns that traders use to help recognize trading opportunities and better time their entries and exits, but there are four distinct ways to define potential outcomes of candlestick patterns:
1. Bullish candlestick patterns show that a stock’s price is dominated by buyers and the price is likely to increase.
2. Bearish patterns may indicate selling pressure and a potential decrease in the stock’s price.
3. Reversal candlestick patterns may demonstrate that the price trend of a stock could reverse.
4. Continuation patterns may indicate that the stock’s price will continue heading in the direction it’s currently going.
It’s important to remember that some patterns may be interpreted as a signal not to trade. Knowing when not to buy or sell is just as important as knowing when to take action.
Bullish Candlestick Patterns
A bullish candlestick pattern can either be an indication of a continued bullish trend, or it could be a reversal from a bearish trend. There are a number of popular bullish candlestick patterns, each of which can tell a trader something different.
Morning Star: The Morning Star is a three-candlestick pattern that may indicate a reversal from a bearish trend towards a bullish trend. The first candle is long-bodied and red. The second candle opens lower and has a short body, often with a gap and a small body. Its color may vary. The third candle is green and closes at or above the center of the first candle body.
Morning Star Doji: This three-candlestick pattern is sometimes interpreted as a possible reversal from a bearish trend. The first candle has a long body showing a downtrend. The second candle opens at a lower price and trades within a narrow price range, then the third candle reverses in a bullish direction, closing at or above the center of the first candle body.
Bullish Engulfing: In this two-candle pattern, the first candle is bearish and the second is bullish. The body of the first candle fits completely within the body of the second larger candle, which engulfs it. Although both candles are important, the higher the high of the second candle’s body, the more some traders may view it as a potential reversal signal.
Hammer: This single-candle pattern typically appears at the end of a decline. The hammer candle looks like a hammer, with a short real body with little or no upper shadow. This shows that the low for the period is significantly lower than the close for that period, which is generally viewed as a potential bullish reversal after a downtrend. However, many traders look for confirmation, such as a higher close on the next candle, before acting on the pattern.
Inverted Hammer: The inverse of the hammer pattern, this is a single-candle pattern which may suggest weakening downward momentum and can indicate the end of a downtrend and reversal towards a bullish movement.
This candle has a short real body near the low, little or no lower shadow, and a long upper shadow. Unlike a hammer, the inverted hammer may show buyers testing higher prices but failing to hold them. This makes confirmation on the next candle especially important.
Bullish Harami: This reversal pattern happens during a downtrend and may suggest a switch toward upward price movement. It looks like a short green candlestick that follows several red candlesticks. The green candlestick body fits within the body of the previous red candlestick.
Dragonfly Doji: This is a pattern some traders view as a possible reversal signal. In this pattern, a doji candle opens and closes at or near the highest price of the day. The lower shadow tends to be long, but it can vary in length.
Piercing Line: In this two-candle pattern, the first candle is long and red, followed by a long green candle that opens below the prior close and closes above the midpoint of the first candle’s real body. This pattern is often interpreted as a potential bullish reversal after a bearish trend.
Stick Sandwich: This is a three-candle pattern with an opposite-colored middle candle that consists of a long candle sandwiched between two long candles of the other color. The closing prices of the two outer candles are similar, creating a potential level of support that some traders interpret as a possible bullish signal.
Three White Soldiers: A three-candle pattern that looks like a staircase toward higher prices, sometimes viewed as a potential bullish continuation signal. It consists of three green candles, each of which opens within or above the prior candle’s body and closes progressively higher.
Bearish Candlestick Patterns
Bearish candlestick patterns may indicate an ongoing bearish trend, or they may indicate a reversal from a bullish trend. These are some common bearish candlestick patterns.
Evening Star: This three-candle pattern is the opposite of the Morning Star, sometimes interpreted as a possible shift from bullish to bearish momentum. The first candle is long and green. The second candle gaps up and has a short body. The body can be either red or green but doesn’t overlap with the body of the previous candle. This shows that buying interest is coming to an end. The third candle is red and closes at or below the center of the first candle body.
Evening Star Doji: This three-candle pattern is the opposite of the Morning Star Doji. It is sometimes seen as a possible reversal towards a bearish trend. The first candle is a long green candle. The second candle is a doji, or is very narrow and gaps up to a higher price. The third candle is red and closes at or below the center point of the first candle body.
Shooting Star: This is a single-candle pattern defined by shape with a small real body near the low, very little or no lower shadow, and a long upper shadow. The shooting star may be interpreted as a potential sign of weakening upward momentum.
Hanging Man: This is a single candlestick pattern that appears after an uptrend and may indicate a potential bearish reversal. The candle has a long lower wick and a short candle body. Despite resembling a hammer, it typically signals selling pressure after a rally and is not bullish.
Dark Cloud Cover: A two-candlestick pattern that occurs when a red candle has an opening price that’s higher than the closing price of the previous day’s candle, and a closing price below the middle of the previous one. The first candle is green. The second candle, which is red, completes the pattern by closing below the midpoint of the prior green candle.
Bearish Harami Cross: A trend-reversal pattern consisting of a series of green candlesticks followed by a doji, this pattern is sometimes interpreted as a sign that the uptrend may be losing momentum and preparing for a reversal.
Two Black Gapping: This pattern appears near a top and happens when price gaps down and then prints two red candles that gap down again. This is sometimes viewed as a potential bearish sign of an emerging bearish trend.
Gravestone Doji: This is an inverted dragonfly pattern, in which the opening and closing price are at or near the low of the day. The upper candle shadow tends to be long, but can vary in length. It is generally viewed as a potential bearish reversal, especially after an uptrend, but often requires confirmation.
Three Black Crows: This bearish reversal pattern appears after an uptrend and consists of three long red candlesticks. Each opens with the real body of the prior candle and closes lower, showing sustained selling pressure.
Reversal Patterns
Harami Cross: The Harami Cross can indicate a reversal in either a bullish or a bearish trend. It’s a two-candlestick pattern in which the first candle is a long real body in the prevailing trend, and the second candle is a doji within its body.
Abandoned Baby: This reversal pattern is made up of three candles. The middle candle is a doji that is isolated by gaps on both sides, with no overlap to adjacent candles (i.e., “standing alone”). The third candle moves strongly in the opposite direction after the gap. The first and third candles have relatively long bodies. It’s so named because the gaps have space between the doji candle’s wick and both wicks of the first and third candles.
Continuation Patterns
Falling Three Methods: This is a five-candlestick bearish continuation pattern which may reflect a brief pause within a continuing downtrend. The first is a long red candle, followed by three small green candles, which all stay within the range of the first candle. The last candle is another long red one. This pattern may suggest buyers have not yet shifted the downtrend’s momentum.
Three Line Strike: A four-candlestick pattern that consists of three same-direction candles followed by a long, counter-trending candle, and is sometimes interpreted as a potential trend continuation or, depending on the context, a reversal signal. The fourth candle typically engulfs the prior three candlesticks’ real bodies.
Other Patterns
These two patterns don’t fit into the bullish, bearish, reversal, or continuation categories.
Spinning Top: A short-bodied candlestick with similar top and bottom wicks that looks like a spinning top. This is an indication of indecision in the market. After the spinning top, the market may move quickly one way or another, so prior price movement and patterns may help assess whether the stock will move up or down.
Supernova: If there’s a high-volume, low-float stock that experiences a price explosion, followed by a sharp price drop, this is a supernova. There can be trading opportunities on the way up, and then opportunities to short sell on the way down as well.
The Takeaway
Candlestick charts are a stock analysis tool, and traders who can identify patterns within them may assess whether a stock’s price may rise or fall. It can help them make a decision of when or if to buy, sell, or stand pat. There are numerous types of candlestick patterns, though it’s important to remember that patterns do not always lead to the predicted outcome.
Reading stock charts is only one small part of the investing world, and a rather complicated part, too. There are simpler, less-intensive ways to participate in the markets. For traders who understand their limits, candlestick patterns can still offer a practical read on near-term supply and demand.
Invest in what matters most to you with SoFi Active Invest. In a self-directed account provided by SoFi Securities, you can trade stocks, exchange-traded funds (ETFs), mutual funds, alternative funds, options, and more — all while paying $0 commission on every trade. Other fees may apply. Whether you want to trade after-hours or manage your portfolio using real-time stock insights and analyst ratings, you can invest your way in SoFi's easy-to-use mobile app.
FAQ
What is the most reliable candlestick pattern?
No candlestick pattern can guarantee accuracy, but many traders view the engulfing pattern as a strong signal, especially in combination with volume. Some confirmation from the next candle is often used before acting.
Can candlestick patterns be used for all asset classes?
Yes — candlestick patterns can apply to stocks, ETFs, and even futures. However, their reliability may vary depending on the asset’s liquidity and volatility.
How do you confirm a candlestick pattern?
Traders often look for confirmation through the next candle’s direction, volume changes, or supporting indicators, such as the Relative Strength Index (RSI). The RSI is a momentum indicator that measures how quickly prices are rising or falling, which may help traders identify potential overbought or oversold conditions.
Are candlestick patterns useful for day trading?
Candlestick patterns are widely used in day trading and options trading strategies in general to identify short-term price setups. That said, success often depends on combining them with other technical signals.
What are common mistakes when reading candlestick charts?
Relying on patterns without context, skipping confirmation, and ignoring volume are common errors. It’s also a mistake to treat any pattern as a guaranteed prediction.
INVESTMENTS ARE NOT FDIC INSURED • ARE NOT BANK GUARANTEED • MAY LOSE VALUE
For disclosures on SoFi Invest platforms visit SoFi.com/legal. For a full listing of the fees associated with Sofi Invest please view our fee schedule.
Disclaimer: The projections or other information regarding the likelihood of various investment outcomes are hypothetical in nature, do not reflect actual investment results, and are not guarantees of future results.
Financial Tips & Strategies: The tips provided on this website are of a general nature and do not take into account your specific objectives, financial situation, and needs. You should always consider their appropriateness given your own circumstances.
SOIN-Q325-057