If you ask any financial advisor when you should start saving for retirement, their answer would likely be simple: Now, or in your 20s if possible.
It’s not always easy to prioritize investing for retirement. If you’re in your 20s or 30s, you might have student loans or other goals that seem more “immediate,” such as a down payment on a house or your child’s tuition. But starting early is important because it can allow you to save much more. In fact, setting aside a little every year starting in your 20s could mean an additional hundreds of thousands of dollars of accumulated investment earnings by retirement age.
No matter what age you are, putting away money for the future is a good idea. Read on to learn more about when to start saving for retirement and how to do it.
Key Points
• Starting to save for retirement in your 20s is ideal, as it gives your money more time to potentially grow and benefit from compounding. Compounding occurs when any earnings received are added to your principal balance, so future earnings are calculated on this updated, larger amount.
• Assessing personal financial situations and retirement goals is crucial when determining how much to save for retirement, regardless of age.
• Individuals in their 30s, 40s, 50s, or 60s can still successfully start saving for retirement, with different strategies tailored to each age group.
• Regular contributions and taking advantage of employer-sponsored plans are key steps in building a solid retirement savings strategy at any age.
This article is part of SoFi’s Retirement Planning Guide, our coverage of all the steps you need to create a successful retirement plan.
What Is the Ideal Age to Start Saving for Retirement?
Ideally, you should start saving for retirement in your 20s, if possible. By getting started early, you could reap the benefits of compound interest. That’s when money in savings accounts earns interest, that interest is added to the principal amount in the account, and then interest is earned on the new higher amount.
Starting to save for retirement in your 20s can allow you to save much more. In fact, setting aside a little every year starting in your 20s could mean an additional hundreds of thousands of dollars of accumulated investment earnings by retirement age.
That said, if you are older than your 20s, it’s not too late to start saving for retirement. The important thing is to get started, no matter what your age.
The #1 Reason to Start Early: Compound Interest
If you start saving early, you could reap the benefits of compound interest.
CFP®, Brian Walsh says, “Time can either be your best friend or your worst enemy. If you start saving early, you make it a habit, and you start building now, time becomes your best friend because of compounded growth. If you delay — say 5, 10, 15 years to save — then time becomes your worst enemy because you don’t have enough time to make up for the money that you didn’t save.”
Here’s how compound interest works and why it can be so valuable: The money in a savings account, money market account, or CD (certificate of deposit) earns interest. That interest is added to the balance or principle in the account, and then interest is earned on the new higher amount.
Depending on the type of account you have, interest might accrue daily, weekly, monthly, quarterly, twice a year, or annually. The more frequently interest compounds on your savings, the greater the benefit for you.
Investments — including investments in retirement plans, such as an employee-sponsored 401(k) plan or a traditional or Roth IRA — likewise benefit from compounding returns. Over time, you can see returns on both the principal as well as the returns on your contributions. Essentially, your money can work for you and potentially grow through the years, just through the power of compound returns.
The sooner you start saving and investing, the more time compounding has to do its work.
💡 Quick Tip: If you’re opening a brokerage account for the first time, consider starting with an amount of money you’re prepared to lose. Investing always includes the risk of loss, and until you’ve gained some experience, it’s probably wise to start small.
Saving Early vs Saving Later
To understand the power of compound returns, consider this:
If you start investing $7,000 a year at age 25, by the time you reach age 67, you’d have a total of $2,129,704.66. However, if you waited until age 35 to start investing the same amount, and got the same annual return, you’d have $939,494.76.
Age
Annual Return
Savings
25
8%
$2,129,704.66
35
8%
$939,494.76
As you can see, starting in your 20s means you may save double the amount you would have if you waited until your 30s.
Starting Retirement Savings During Different Life Stages
Retirement is often considered the single biggest expense in many peoples’ lives. Think about it: You may be living for 20 or more years with no active income.
Plus, while your parents or grandparents likely had a pension plan that kicked off right at the age of 65, that may not be the case for many workers in younger generations. Instead, the 401(k) model of retirement that’s more common these days requires employees to do their own saving.
As you get started on your savings journey, do a quick assessment of your current financial situation and goals. Be sure to factor in such considerations as:
• Age you are now
• Age you’d like to retire
• Your income
• Your expenses
• Where you’d like to live after retirement (location and type of home)
• The kind of lifestyle you envision in retirement (hobbies, travel, etc.)
To see where you’re heading with your savings you could use a retirement savings calculator. But here are more basics on how to get started on your retirement savings strategy, at any age.
Starting in Your 20s
Starting to save for retirement in your 20s is something you’ll later be thanking yourself for.
As discussed, the earlier you start investing, the better off you’re likely to be. No matter how much or little you start with, having a longer time horizon till retirement means you’ll be able to handle the typical ups and downs of the markets.
Plus, the sooner you start saving, the more time you’ll be able to benefit from compound returns, as noted.
Start by setting a goal: At what age would you like to retire? Based on current life expectancy, how many years do you expect to be retired? What do you imagine your retirement lifestyle will look like, and what might that cost?
Then, create a budget, if you haven’t already. Document your income, expenses, and debt. Once you do that, determine how much you can save for retirement, and start saving that amount right now.
If your 20s have come and gone and you haven’t started investing in your retirement, your 30s is the next-best time to start. While there may be other expenses competing for your budget right now — saving for a house, planning for kids or their college educations — the truth remains that the sooner you start retirement savings, the more time they’ll have to grow.
If you’re employed full-time, one easy way to start is to open an employer-sponsored retirement savings plan, like a 401(k). In 2025, you can contribute up to $23,500 in a 401(k), and in 2026, you can contribute up to $24,500.
One benefit to note is that your savings will come out of your paycheck each month before you get taxed on that money. Not only does this automate retirement savings, but it means after a while you won’t even miss that part of your paycheck that you never really “had” to begin with. (And yes, Future You will thank you.)
When it comes to how much you should have saved for retirement by 40, one general guideline is to have the equivalent of your two to three times your annual salary saved in retirement money.
Once you have high-interest debt (like debt from credit cards) paid off, and have a good chunk of emergency savings set aside, take a good look at your monthly budget and figure out how to reallocate some money to start building a retirement savings fund.
Not only will regular contributions get you on a good path to savings, but one-off sources of money (from a bonus, an inheritance, or the sale of a car or other big-ticket item) are another way to help catch up on retirement savings faster.
Starting in Your 50s
In your 50s, a good ballpark goal is to have six times your annual salary in your retirement savings by the end of the decade. But don’t panic if you’re not there yet — there are a few ways you can catch up.
Specifically, the government allows individuals aged 50 and older to make “catch-up contributions” to 401(k), traditional IRA, and Roth IRA plans. That’s an additional $7,500 in 401(k) savings, and an additional $1,000 in IRA savings for 2025, and an extra $8,000 in 401(k) savings, and an extra $1,100 in IRA savings for 2026. (Note that in 2025 and 2026, those aged 60 to 63 may contribute up to an additional $11,250 to a 401(k), instead of $7,500 or $8,000.)
Also, under a new law that went into effect on January 1, 2026 (as part of SECURE 2.0), individuals aged 50 and older who earned more than $150,000 in FICA wages in 2025 are required to put their 401(k) catch-up contributions into a Roth account. With Roth accounts, individuals pay taxes on contributions upfront, but can make qualified withdrawals tax-free in retirement.
The opportunity is there, but only you can manage your budget to make it happen. Once you’ve earmarked regular contributions to a retirement savings account, make sure to review your asset allocation on your own or with a professional. A general rule of thumb is, the closer you get to retirement age, the larger the ratio of less risky investments (like bonds or bond funds) to more volatile ones (like stocks, mutual funds, and ETFs) you should have.
Starting in Your 60s
It’s never too late to start investing, especially if you’re still working and can contribute to an employer-sponsored retirement plan that may have matching contributions. If you’re contributing to a 401(k), or a Roth or traditional IRA, don’t forget about catch-up contributions (see the information above).
In general, when you’re this close to retirement it makes sense for your investments to be largely made up of bonds, cash, or cash equivalents. Having more fixed-income securities in your portfolio helps lower the odds of suffering losses as you get closer to your target retirement date.
Investing in retirement and wealth accounts is a great way to jump-start saving and investing for your golden years, whether you invest $10,000 or just $100 to get started.
The first step is to open an account or use the one that’s already open. You could also increase your contribution. If you’re opening an account, you may want to consider one without fees, to help maximize your bottom line.
Prepare for your retirement with an individual retirement account (IRA). It’s easy to get started when you open a traditional or Roth IRA with SoFi. Whether you prefer a hands-on self-directed IRA through SoFi Securities or an automated robo IRA with SoFi Wealth, you can build a portfolio to help support your long-term goals while gaining access to tax-advantaged savings strategies.
Easily manage your retirement savings with a SoFi IRA.
FAQ
Is 20 years enough to save for retirement?
It’s never too late to start investing for retirement. If you’re just starting in your 40s, consider contributing to an employer-sponsored plan if you can, so that you can take advantage of any employer matching contributions. In addition to regular bi-weekly or monthly contributions, make every effort to deposit any “windfall” lump sums (like a bonus, inheritance, or proceeds from the sale of a car or house) into a retirement savings vehicle in an effort to catch up faster.
Is 25 too late to start saving for retirement?
It’s not too late to start saving for retirement at 25. Take a look at your budget and determine the max you can contribute on a regular basis — whether through an employer-sponsored plan, an IRA, or a combination of them. Then start making contributions, and consider them as non-negotiable as rent, mortgage, or a utility bill.
Is 30 too old to start investing?
No age is too old to start investing for retirement, because the best time to start is today. The sooner you start investing, the more advantage you can take of compound returns, and potentially employer matching contributions if you open an employer-sponsored retirement plan.
Should I prioritize paying off debt over saving for retirement?
Whether you should prioritize paying off debt over saving for retirement depends on your personal situation and the type of debt you have. If your debt is the high-interest kind, such as credit card debt, for instance, it could make sense to pay off that debt first because the high interest is costing you extra money. The less you owe, the more you’ll be able to put into retirement savings.
And consider this: You may be able to pay off your debt and save simultaneously. For instance, if your employer offers a 401(k) with a match, enroll in the plan and contribute enough so that the employer match kicks in. Otherwise, you are essentially forfeiting free money. At the same time, put a dedicated amount each week or month to repaying your debt so that you continue to chip away at it. That way you will be reducing your debt and working toward saving for your retirement.
INVESTMENTS ARE NOT FDIC INSURED • ARE NOT BANK GUARANTEED • MAY LOSE VALUE
SoFi Invest is a trade name used by SoFi Wealth LLC and SoFi Securities LLC offering investment products and services. Robo investing and advisory services are provided by SoFi Wealth LLC, an SEC-registered investment adviser. Brokerage and self-directed investing products offered through SoFi Securities LLC, Member FINRA/SIPC.
For disclosures on SoFi Invest platforms visit SoFi.com/legal. For a full listing of the fees associated with Sofi Invest please view our fee schedule.
Third-Party Brand Mentions: No brands, products, or companies mentioned are affiliated with SoFi, nor do they endorse or sponsor this article. Third-party trademarks referenced herein are property of their respective owners.
Tax Information: This article provides general background information only and is not intended to serve as legal or tax advice or as a substitute for legal counsel. You should consult your own attorney and/or tax advisor if you have a question requiring legal or tax advice.
Exchange Traded Funds (ETFs): Investors should carefully consider the information contained in the prospectus, which contains the Fund’s investment objectives, risks, charges, expenses, and other relevant information. You may obtain a prospectus from the Fund company’s website or by emailing customer service at [email protected]. Please read the prospectus carefully prior to investing.
Fund Fees
If you invest in Exchange Traded Funds (ETFs) through SoFi Invest (either by buying them yourself or via investing in SoFi Invest’s automated investments, formerly SoFi Wealth), these funds will have their own management fees. These fees are not paid directly by you, but rather by the fund itself. these fees do reduce the fund’s returns. Check out each fund’s prospectus for details. SoFi Invest does not receive sales commissions, 12b-1 fees, or other fees from ETFs for investing such funds on behalf of advisory clients, though if SoFi Invest creates its own funds, it could earn management fees there.
SoFi Invest may waive all, or part of any of these fees, permanently or for a period of time, at its sole discretion for any reason. Fees are subject to change at any time. The current fee schedule will always be available in your Account Documents section of SoFi Invest.
Financial Tips & Strategies: The tips provided on this website are of a general nature and do not take into account your specific objectives, financial situation, and needs. You should always consider their appropriateness given your own circumstances.
Third Party Trademarks: Certified Financial Planner Board of Standards Center for Financial Planning, Inc. owns and licenses the certification marks CFP®, CERTIFIED FINANCIAL PLANNER®
Disclaimer: The projections or other information regarding the likelihood of various investment outcomes are hypothetical in nature, do not reflect actual investment results, and are not guarantees of future results.
Maxing out your 401(k) involves contributing the maximum allowable amount to your workplace retirement account to increase the benefit of compounding and appreciating assets over time.
All retirement plans come with contribution caps, and when you hit that limit it means you’ve maxed out that particular account.
There are a lot of things to consider when figuring out how to max out your 401(k) account, including whether maxing out your account is a good idea in the first place. Read on to learn about the pros and cons of maxing out your 401(k).
Key Points
• Maxing out your 401(k) contributions can help you save more for retirement and take advantage of tax benefits.
• If you want to max out your 401(k), strategies include contributing enough to get the full employer match, increasing contributions over time, utilizing catch-up contributions if eligible, automating contributions, and adjusting your budget to help free up funds for additional 401(k) contributions.
• Diversifying your investments within your 401(k) and regularly reviewing and rebalancing your portfolio can optimize your returns.
• Seeking professional advice and staying informed about changes in contribution limits and regulations can help you make the most of your 401(k).
What Exactly Does It Mean to ‘Max Out Your 401(k)?’
Maxing out your 401(k) means that you contribute the maximum amount allowed in a given year, as specified by the established 401(k) contribution limits. But it can also mean that you’re maxing out your contributions up to an employer’s percentage match.
If you want to max out your 401(k) in 2025, you’ll need to contribute $23,500. If you’re 50 or older, you can contribute an additional $7,500, for an annual total of $31,000. In addition, in 2025, those aged 60 to 63 may contribute up to an additional $11,250 instead of $7,500, thanks to SECURE 2.0, for an annual total of $34,750.
To max out your 401(k) in 2026, you would need to contribute $24,500. If you’re 50 or older, you can contribute an additional catch-up contribution of $8,000, for a total for the year of $32,500. Also in 2026, those aged 60 to 63 may contribute up to an additional $11,250 SECURE 2.0 catch-up instead of $8,000, for an annual total of $35,750.
Should You Max Out Your 401(k)?
Generally speaking, yes, it’s a good thing to max out your 401(k) so long as you’re not sacrificing your overall financial stability to do it. Saving for retirement is important, which is why many financial experts would likely suggest maxing out any employer match contributions first.
But while you may want to take full advantage of any tax and employer benefits that come with your 401(k), you also want to consider any other financial goals and obligations you have before maxing out your 401(k).
That doesn’t mean you should put other goals first, and not contribute to your retirement plan at all. That’s not wise. Maintaining a baseline contribution rate for your future is crucial, even as you continue to save for shorter-term aims or put money toward debt repayment.
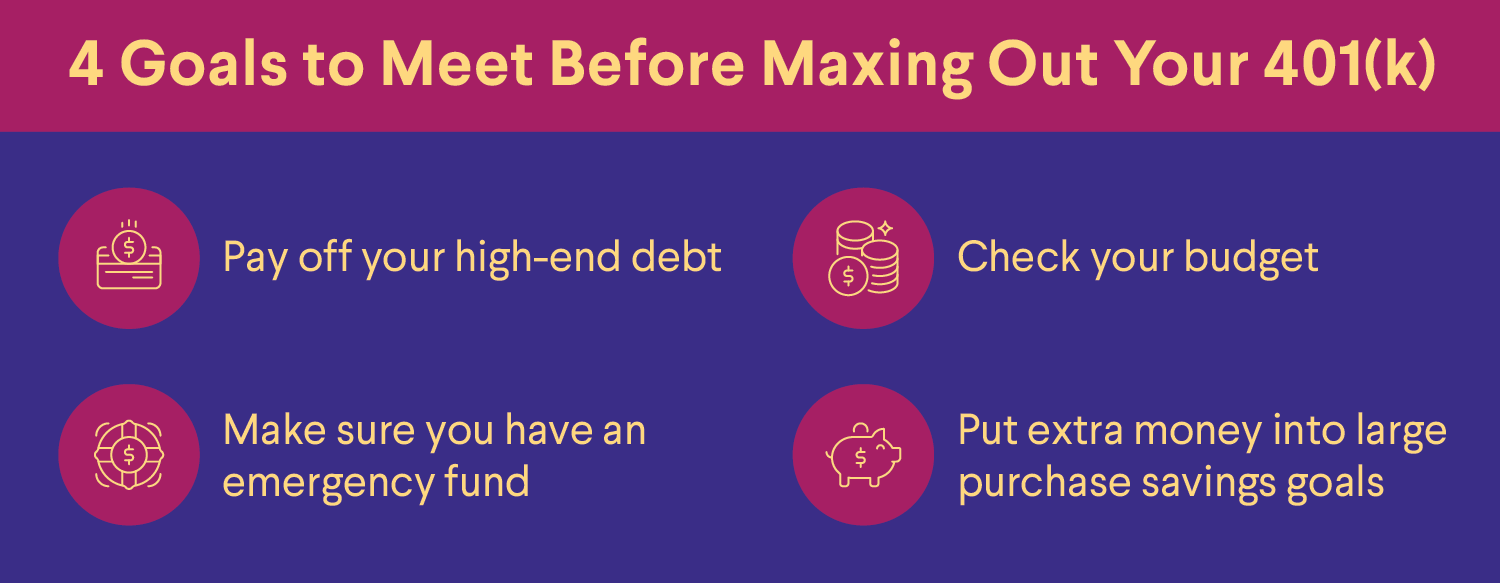
Other goals might include:
• Is all high-interest debt paid off? High-interest debt like credit card debt should be paid off first, so it doesn’t accrue additional interest and fees.
• Do you have an emergency fund? Life can throw curveballs — it’s smart to be prepared for job loss or other emergency expenses.
• Is there enough money in your budget for other expenses? You should have plenty of funds to ensure you can pay for additional bills, like student loans, health insurance, and rent.
• Are there other big-ticket expenses to save for? If you’re saving for a large purchase, such as a home or going back to school, you may want to put extra money toward this saving goal rather than completely maxing out your 401(k), at least for the time being.
Once you can comfortably say that you’re meeting your spending and savings goals, it might be time to explore maxing out your 401(k). There are many reasons to do so — it’s a way to take advantage of tax-deferred savings, employer matching (often referred to as “free money”), and it’s a relatively easy and automatic way to invest and save, since the money gets deducted from your paycheck once you’ve set up your contribution amount.
How to Max Out Your 401(k)
Only a relatively small percentage of people max out their 401(k)s, but that doesn’t mean you can’t be one of them. Here are some strategies for how to max out your 401(k).
1. Max Out 401(k) Employer Contributions
Your employer may offer matching contributions, and if so, there are typically rules you will need to follow to take advantage of their match.
An employer may require a minimum contribution from you before they’ll match it, or they might match only up to a certain amount. They might even stipulate a combination of those two requirements. Each company will have its own rules for matching contributions, so review your company’s policy for specifics.
For example, suppose your employer will match your contribution up to 3%. So, if you contribute 3% to your 401(k), your employer will contribute 3% as well. Therefore, instead of only saving 3% of your salary, you’re now saving 6%. With the employer match, your contribution just doubled. Note that employer contributions can range from nothing at all up to a certain limit. It depends on the employer and the plan.
Since saving for retirement is one of the best investments you can make, it’s wise to take advantage of your employer’s match. Every penny helps when saving for retirement, and you don’t want to miss out on this “free money” from your employer.
If you’re not already maxing out the matching contribution and wish to, you can speak with your employer (or HR department, or plan administrator) to increase your contribution amount, you may be able to do it yourself online.
2. Max Out Salary-Deferred Contributions
While it’s smart to make sure you’re not leaving free money on the table, maxing out your employer match on a 401(k) is only part of the equation.
In order to make sure you’re setting aside an adequate amount for retirement, consider contributing as much as your budget will allow. As noted earlier, individuals younger than age 50 can contribute up to $23,500 in 2025, and up to $24,500 in 2026.
Those contributions aren’t just an investment in your future lifestyle in retirement. Because they are made with pre-tax dollars, they lower your taxable income for the year in which you contribute. For some, the immediate tax benefit is as appealing as the future savings benefit.
3. Take Advantage of Catch-Up Contributions
As mentioned, 401(k) catch-up contributions allow investors aged 50 and over to increase their retirement savings — which is especially helpful if they’re behind in reaching their retirement goals.
Individuals 50 and over can contribute an additional $7,500 for a total of $31,000 in 2025. And in 2026, those 50 and older can contribute an extra $8,000 for a total of $32,500. And in both 2025 and 2026, those aged 60 to 63 can contribute up to an additional $11,250, instead of $7,500 in 2025 and $8,000 in 2026, for a total of $34,750 and $35,750 respectively. Putting all of that money toward retirement savings can help you truly max out your 401(k).
As you draw closer to retirement, catch-up contributions can make a difference, especially as you start to calculate when you can retire. Whether you have been saving your entire career or just started, this benefit is available to everyone who qualifies.
And of course, in many cases, this extra contribution will lower taxable income even more than regular contributions. Although using catch-up contributions may not push everyone to a lower tax bracket, it will certainly minimize the tax burden during the next filing season for many filers — with an important exception.
Under a new law regarding catch-up contributions that went into effect on January 1, 2026 (as part of SECURE 2.0), individuals aged 50 and older whose FICA wages exceeded $150,000 in 2025 are required to put their 401(k) catch-up contributions into a Roth 401(k) account. Because of the way Roth accounts work, these individuals will pay taxes on their catch-up contributions upfront, and make eligible withdrawals tax-free in retirement. This means their taxable income will not be lowered; they could even potentially move into higher tax bracket. Those impacted by the new law should check with their employer or plan administrator to find out how to proceed.
4. Reset Your Automatic 401(k) Contributions
When was the last time you reviewed your 401(k)? It may be time to check in and make sure your retirement savings goals are still on track. Is the amount you originally set to contribute each paycheck still the correct amount to help you reach those goals?
With the increase in contribution limits most years, it may be worth reviewing your budget to see if you can up your contribution amount to max out your 401(k). If you don’t have automatic payroll contributions set up, you could set them up.
It’s generally easier to save money when it’s automatically deducted; a person is less likely to spend the cash (or miss it) when it never hits their checking account in the first place.
If you’re able to max out the full 401(k) limit, but fear the sting of a large decrease in take-home pay, consider a gradual, annual increase such as 1% — how often you increase it will depend on your plan rules as well as your budget.
5. Put Bonus Money Toward Retirement
Unless your employer allows you to make a change, your 401(k) contribution may be deducted from any bonus you might receive at work. Some employers allow you to determine a certain percentage of your bonus to contribute to your 401(k).
Consider possibly redirecting a large portion of a bonus to 401k contributions, or into another retirement account, such as an individual retirement account (IRA). Because this money might not have been expected, you won’t miss it if you contribute most of it toward your retirement.
You could also do the same thing with a raise. If your employer gives you a raise, consider putting it directly toward your 401(k). Putting this money directly toward your retirement can help you inch closer to maxing out your 401(k) contributions.
6. Maximize Your 401(k) Returns and Fees
Many people may not know what they’re paying in investment fees or management fees for their 401(k) plans. By some estimates, the average fees for 401(k) plans are between 0.5% and 2%, but some plans may have higher fees.
Fees add up — even if your employer is paying the fees now, you’ll have to pay them if you leave the job and keep the 401(k).
Essentially, if an investor has $100,000 in a 401(k) and pays $1,000 or 1% (or more) in fees per year, the fees could add up to thousands of dollars over time. Any fees you have to pay can chip away at your retirement savings and reduce your returns.
It’s important to ensure you’re getting the most for your money in order to maximize your retirement savings. If you are currently working for the company, you could discuss high fees with your HR team.
One way to potentially lower your costs is to find more affordable investment options. Generally speaking, index funds often charge lower fees than other investments. If an employer’s plan offers an assortment of low-cost index funds, may consider investing in these funds to save some money and help build a diversified portfolio.
What Happens If You Contribute Too Much to Your 401(k)?
After an individual maxes out their 401(k) for the year — meaning they’ve hit the contribution limit corresponding to their age range — if they don’t stop making contributions they will risk paying additional taxes on their overcontributions.
In the event that an individual makes an overcontribution, they might let their plan manager or administrator know, and withdraw the excess amount. If they leave the excess in the account, it’ll be taxed twice — once when it was contributed initially, and again when they take it out.
What to Do After Maxing Out a 401(k)?
If you max out your 401(k) this year, pat yourself on the back. Maxing out your 401(k) is a financial accomplishment. But now you might be wondering, what’s next? Here are some additional retirement savings options to consider if you have already maxed out your 401(k).
Open an IRA
An individual retirement account (IRA) can be an option to complement an employer’s retirement plans. With a traditional IRA, you can contribute pre-tax dollars up to the annual limit, which is $7,000 in 2025. If you’re 50 or older, you can contribute an extra $1,000, for an annual total of $8,000 in 2025. In 2026, you can contribute up to $7,500, while those 50 and older can contribute an additional $1,100, for a total of $8,600 for 2026.
You may also choose to consider a Roth IRA. As with a traditional IRA, the annual contribution limit for a Roth IRA in 2025 is $7,000, and $8,000 for those 50 or older. And in 2026, the annual Roth IRA contribution limit is $7,500, and $8,600 for those age 50 and up.
Roth IRA accounts have income limits, but if you’re eligible, you can contribute with after-tax dollars, which means you won’t have to pay taxes on earnings withdrawals in retirement as you do with traditional IRAs.
It’s possible to open an IRA at a brokerage, mutual fund company, or other financial institution. If you ever leave your job, you can typically roll your employer’s 401(k) into your IRA without facing tax consequences as long as both accounts are similarly taxed, such as rolling funds from a traditional 401(k) to a traditional IRA, and funds are transferred directly from one plan to the other. Doing a 401(k) to IRA rollover may allow you to invest in a broader range of investments with lower fees.
Boost an Emergency Fund
Experts often advise establishing an emergency fund with at least three to six months of living expenses before contributing to a retirement savings plan. Perhaps you’ve already done that — but haven’t updated that account in a while. As your living expenses increase, it’s a good idea to make sure your emergency fund grows, too. This will cover you financially in case of life’s little curveballs: new brake pads, a new roof, or unforeseen medical expenses.
Save for Health Care Costs
Contributing to a health savings account (HSA) can reduce out-of-pocket costs for expected and unexpected health care expenses, though you can only open and contribute to an HSA if you are enrolled in a high-deductible health plan (HDHP).
For tax year 2025, those eligible can contribute up to $4,300 pre-tax dollars for an individual plan or up to $8,550 for a family plan. Those 55 or older who are not enrolled in Medicare can make an additional catch-up contribution of $1,000 per year.
For tax year 2026, those who are eligible can contribute up to $4,400 for an individual plan or up to $8,750 for a family plan. Those 55 or older who are not enrolled in Medicare can again make an additional catch-up of $1,000.
The money in this account can be used for qualified out-of-pocket medical expenses such as copays for doctor visits and prescriptions. Another option is to leave the money in the account and let it grow for retirement. Once you reach age 65, you can take out money from your HSA without a penalty for any purpose. However, to be exempt from taxes, the money must be used for a qualified medical expense. Any other reasons for withdrawing the funds will be subject to regular income taxes.
Increase College Savings
If you’re feeling good about maxing out your 401(k), consider increasing contributions to your child’s 529 college savings plan (a tax-advantaged account meant specifically for education costs, sponsored by states and educational institutions).
College costs continue to creep up every year. Helping your children pay for college helps minimize the burden of college expenses, so they hopefully don’t have to take on many student loans.
Open a Brokerage Account
After maxing out a 401(k), individuals might also consider opening a brokerage account. Brokerage firms offer various types of investment accounts, each with different services and fees. A full-service brokerage firm may provide different financial services, which include allowing investors to trade securities.
Many brokerage firms require individuals to have a certain amount of cash to open accounts and have enough funds for trading fees and commissions. While there are no limits on how much can be contributed to the account, earned dividends are taxable in the year they are received. Therefore, if you earn a profit or sell an asset, you must pay a capital gains tax. On the other hand, if you sell a stock at a loss, that becomes a capital loss. This means that the transaction may yield a tax break by lowering your taxable income.
Pros and Cons of Maxing Out Your 401(k)
thumb_up
Pros:
• Increased Savings: More contributions added to a retirement savings plan could lead to more growth over time.
• Simplified Saving and Investing: Maxing out your 401(k) can also make your saving and investing relatively easy, as long as you’re taking a no-lift approach to setting your money aside thanks to automatic contributions.
thumb_down
Cons:
• Affordability: Maxing out a 401(k) may not be financially feasible for everyone. It may be challenging due to existing debt or other savings goals.
• Risk: Like all investments, there is the risk of loss.
• Opportunity Costs: Money invested in retirement plans could be used for other purposes. During strong stock market years, non-retirement investments may offer more immediate access to funds.
Test your understanding of what you just read.
The Takeaway
Maxing out your 401(k) involves matching your employer’s maximum contribution match, and also, contributing as much as legally allowed to your retirement plan in a given year. If you have the flexibility in your budget to do so, maxing out a 401(k) can be an effective way to build retirement savings.
And once a 401(k) is maxed out? There are other ways an individual might direct their money, including opening an IRA, or contributing more to an HSA or to a child’s 529 plan.
Prepare for your retirement with an individual retirement account (IRA). It’s easy to get started when you open a traditional or Roth IRA with SoFi. Whether you prefer a hands-on self-directed IRA through SoFi Securities or an automated robo IRA with SoFi Wealth, you can build a portfolio to help support your long-term goals while gaining access to tax-advantaged savings strategies.
Help build your nest egg with a SoFi IRA.
🛈 While SoFi does not offer 401(k) plans at this time, we do offer a range of Individual Retirement Accounts (IRAs).
FAQ
What happens if I max out my 401(k) every year?
Assuming you don’t overcontribute, you may see your retirement savings increase if you max out your 401(k) every year, and hopefully, be able to reach your retirement and savings goals sooner.
Will you have enough to retire after maxing out a 401(k)?
There are many factors that need to be considered to determine if you’ll have enough money to retire if you max out your 401(k). Start by getting a sense of how much you’ll need to retire by using a retirement expense calculator. Then you can decide whether maxing out your 401(k) for many years will be enough to get you there, assuming an average stock market return and compounding built in.
First and foremost, you’ll need to consider your lifestyle and where you plan on living after retirement. If you want to spend a lot in your later years, you’ll need more money. As such, a 401(k) may not be enough to get you through retirement all on its own, and you may need additional savings and investments to make sure you’ll have enough.
What is the best way to max out a 401(k)?
Some effective ways to max out a 401(k) include contributing up to the allowable amount for the year (for 2025, that’s $23,500 for those under age 50, and for 2026, it’s $24,500); using catch-up contributions if you’re aged 50 or older ($7,500 in 2025, and $8,000 in 2026, or $11,250 if you’re ages 60 to 63 in 2025 and 2026); contributing enough to get your employer’s matching contributions if offered; automating your contributions and increasing them yearly, if possible; and directing a percentage of any bonus you receive into your 401(k).
INVESTMENTS ARE NOT FDIC INSURED • ARE NOT BANK GUARANTEED • MAY LOSE VALUE
SoFi Invest is a trade name used by SoFi Wealth LLC and SoFi Securities LLC offering investment products and services. Robo investing and advisory services are provided by SoFi Wealth LLC, an SEC-registered investment adviser. Brokerage and self-directed investing products offered through SoFi Securities LLC, Member FINRA/SIPC.
For disclosures on SoFi Invest platforms visit SoFi.com/legal. For a full listing of the fees associated with Sofi Invest please view our fee schedule.
Financial Tips & Strategies: The tips provided on this website are of a general nature and do not take into account your specific objectives, financial situation, and needs. You should always consider their appropriateness given your own circumstances.
Mutual Funds (MFs): Investors should carefully consider the information contained in the prospectus, which contains the Fund’s investment objectives, risks, charges, expenses, and other relevant information. You may obtain a prospectus from the Fund company’s website or clicking the prospectus link on the fund's respective page at sofi.com. You may also contact customer service at: 1.855.456.7634. Please read the prospectus carefully prior to investing.Mutual Funds must be bought and sold at NAV (Net Asset Value); unless otherwise noted in the prospectus, trades are only done once per day after the markets close. Investment returns are subject to risk, include the risk of loss. Shares may be worth more or less their original value when redeemed. The diversification of a mutual fund will not protect against loss. A mutual fund may not achieve its stated investment objective. Rebalancing and other activities within the fund may be subject to tax consequences.
Investment Risk: Diversification can help reduce some investment risk. It cannot guarantee profit, or fully protect in a down market.
Tax Information: This article provides general background information only and is not intended to serve as legal or tax advice or as a substitute for legal counsel. You should consult your own attorney and/or tax advisor if you have a question requiring legal or tax advice.
Third Party Trademarks: Certified Financial Planner Board of Standards Center for Financial Planning, Inc. owns and licenses the certification marks CFP®, CERTIFIED FINANCIAL PLANNER®
This article is not intended to be legal advice. Please consult an attorney for advice.
Matching in 401(k) retirement accounts involves an employee making a contribution to the account, and their employer mirroring that contribution — or matching it. A 401(k) is a mechanism for saving retirement funds by making pre-tax contributions through deductions from payroll.
Some plans offer a 401(k) employer match, which can be the equivalent of getting “free money” from an employer. That can help increase an investor’s retirement savings over time.
Key Points
• 401(k) matching involves employers contributing to an employee’s retirement plan, matching the employee’s contributions up to a certain limit.
• Benefits include tax-deferred growth on investments and immediate ownership of contributions.
• Matching rates vary, with some employers offering dollar-for-dollar matches and others a percentage.
• Contribution limits are set annually, with additional catch-up contributions allowed for those over 50.
• Vesting schedules determine when employees gain full ownership of employer contributions.
What Is 401(k) Matching?
Matching a 401(k) contribution means that an employer matches or mirrors an employee’s contribution to their retirement account, typically up to a certain percentage. In effect, if an employee contributes $1 to their 401(k), an employer would also contribute $1, thereby “matching” the contribution. But again, there are limits to how much employers are generally willing to match.
There are certain advantages to 401(k) matching.
For one, investment gains and elective deferrals to 401(k) plans are not subject to federal income tax until they’re distributed, which is typically when:
• The participant reaches the age of 59 ½
• The participant becomes disabled, deceased, or otherwise has a severance from employment
• The plan terminates and no subsequent plan is established by the employer
• The participant incurs a financial hardship
Second, elective deferrals are 100% vested. The participant owns 100% of the money in their account, and the employer cannot take it back or forfeit it for any reason.
And third, participants choose how to invest their 401(k). The plans are mainly self-directed, meaning participants decide how they’d like to invest the money in their account. This could mean mutual funds or exchange-traded funds (ETFs) which invest in a wide array of sectors and companies, but typically doesn’t include investing in individual companies and stocks.
Investment tactics might vary from person to person, but by understanding their goals, investors can decide whether their portfolio will have time to withstand market ups and downs with some high-risk, high-reward investments, or if they should shift to a more conservative allocation as they come closer to retirement.
💡 Quick Tip: The advantage of opening a Roth IRA and a tax-deferred account like a 401(k) or traditional IRA is that by the time you retire, you’ll have tax-free income from your Roth, and taxable income from the tax-deferred account. This can help with tax planning.
How Does 401(k) Matching Work?
A 401(k) match is an employee benefit that allows an employer to contribute a certain amount to their employee’s 401(k) plan. The match can be based on a percentage of the employee’s contribution, up to a certain portion of their total salary or a set dollar amount, depending on the terms of the plan.
So, some employers might offer a dollar-for-dollar match, while others might offer matching based on a percentage, or a partial-match. Others may not offer any type of match.
That’s important to keep in mind: Not all employers offer this benefit, and some have prerequisites for participating in the match, such as a minimum required contribution or a cap up to a certain amount.
Meeting with an HR representative or a benefits administrator is a one way to get a better idea of what’s possible. Learning the maximum percent of salary the company will contribute is a start, then the employee can set or increase their contribution accordingly to maximize the employer match benefit.
401(k) Matching Example
Many employers use a match formula to determine their 401(k) matches (assuming they offer it at all). Some formulas are more common than others, too, which can help us with an example.
Consider this: Many 401(k) plans use a single-tier match formula, with $0.50 on the dollar on the first 6% of pay being common. But others use multi-tier match formulas, e.g., dollar-on-dollar on the first 3% of pay and $0.50 on the dollar on the next 2% of pay.
For the sake of breaking a few things down, here’s a retirement saving scenario that can illuminate how 401(k) matching works in real life:
Let’s say a person is 30 years old, with a salary of $50,000, contributing 3% of their salary (or $1,500) to a 401(k). Let’s also say they keep making $50,000 and contributing 3% every year until they’re 65. They will have put $52,500 into their 401(k) in those 35 years.
Now let’s say they opt into an employer match with a dollar-for-dollar up to 3% formula. Putting aside the likelihood of an increase in the value of the investments, they’ll have saved $105,000 — with $52,500 in free contributions from their employer.
That, effectively, is a no-cost way to increase retirement savings by 100%.
Average 401(k) Match
Average 401(k) matches is generally around 4% or 5%, and can vary from year to year. With that in mind, workers who are getting an employer match in that range, or within a broader range — perhaps 3% to 6% — are likely getting a “good” match.
But again, considering that some employers don’t offer any match at all, the chance to secure almost any type of match could be considered good for some investors.
• If a company offers a 401(k) employer match, the participant might consider contributing enough to meet whatever the minimum match requirements are.
• If a participant is closer to retirement age, they’ll probably have a pretty good idea of what they already have saved and what they need to reach their retirement goals. An increase in contributions can make a difference, and maxing out their 401(k) might be a solid strategy.
A retirement calculator can also be helpful in determining what the right contribution amount is for a specific financial situation.
In addition to the uncertainty that can come with choosing how much to contribute to a 401(k), there’s the added pressure of potential penalties for going over the maximum 401(k) contribution limit.
Three common limits to 401(k) contributions:
1. Elective deferral limits: Contribution amounts chosen by an employee and contributed to a 401(k) plan by the employer. In 2025, participants can contribute up to $23,500. In 2026, participants can contribute up to $24,500.
2. Catch-up contribution limits: After the age of 50, participants can contribute more to their 401(k) with catch-up contributions. In 2025, participants can make up to $7,500 in catch-up contributions per year, and in 2026, they can make up to $8,000 in catch-up contributions annually. In both 2025 and 2026, those aged 60 to 63 may contribute up to an additional $11,250, instead of $7,500 and 8,000 respectively, thanks to SECURE 2.0.
However, under a new law that went into effect on January 1, 2026 as part of SECURE 2.0, individuals aged 50 and older who earned more than $150,000 in FICA wages in 2025 are required to put their 401(k) catch-up contributions into a Roth 401(k) account. With Roths, individuals pay taxes on contributions upfront, but can make qualified withdrawals tax-free in retirement.
3. Employer contribution limits: An employer can also make contributions and matches to a 401(k). The combined limit (not including catch-up contributions) on employer and employee contributions in 2025 is $70,000 and in 2026 is $72,000.
If participants think their total deferrals will exceed the limit for that particular year, the IRS recommends notifying the plan to request the difference (an “excess deferral”) “be paid out of any of the plans that permit these distributions. The plan must then pay the employee that amount by April 15 of the following year (or an earlier date specified in the plan).”
401(k) Vesting Schedules
“Vesting ” means “ownership” in a retirement plan. The employee will vest, or own, some percent of their account balance. In the case of a 401(k), being 100% vested means they’ve met their employer’s vesting schedule requirements to ensure complete ownership of their funds.
Vesting schedules, determined by 401(k) plan documents, can lay out certain employer vesting restrictions that range from immediate vesting to 100% vesting after three years to a schedule that increases the vested percentage based on years of service. Either way, all employees must be 100% vested if a plan is terminated by the employer or upon reaching the plan’s standard retirement age.
Tips on Making the Most of 401(k) Matching
Here are some things to keep in mind when trying to make the most of 401(k) matching.
Remember: It’s “Free” Money
An employer match is one part of the overall compensation package and another way to maximize the amount of money an employer pays their employees. Those employees could be turning their backs on free money by not contributing to an employer-matched 401(k) plan.
You Can Reduce Taxable Income
According to FINRA, “with pre-tax contributions, every dollar you save will reduce your current taxable income by an equal amount, which means you will owe less in income taxes for the year. But your take-home pay will go down by less than a dollar.”
If a participant contributed $1,500 a year to a 401(k), they’d only owe taxes on their current salary minus that amount, which could save some serious money as that salary grows.
Every Dollar Counts
It can be tempting to avoid contributing to your retirement plan, and instead, use the money for something you want or need now. But remember: The more time your money has to potentially grow while it’s invested, the more likely you are to reach your financial goals sooner. While that’s not guaranteed, every dollar you can save or invest now for future use is a dollar you don’t need to save or invest later.
The Takeaway
A 401(k) match is an employee benefit that allows an employer to contribute a certain amount to their employee’s 401(k) plan. Matches can be based on a percentage of the employee’s contribution, up to a certain portion of their total salary or a set dollar amount, depending on the terms of the plan.
Taking advantage of employer matches in a 401(k) plan can help workers reach their financial goals sooner, as a match is, in effect, “free money.” If you’re considering how matches can help bolster your investment strategy, it may be worth discussing with a financial professional.
Prepare for your retirement with an individual retirement account (IRA). It’s easy to get started when you open a traditional or Roth IRA with SoFi. Whether you prefer a hands-on self-directed IRA through SoFi Securities or an automated robo IRA with SoFi Wealth, you can build a portfolio to help support your long-term goals while gaining access to tax-advantaged savings strategies.
Help grow your nest egg with a SoFi IRA.
FAQ
How much should I match 401(k)?
It’ll be up to the individual investor, but to make the most of a 401(k) match, workers should likely try to contribute as much as possible up to their employer’s match — it may be worth discussing with a financial professional for additional guidance.
What does 6% 401(k) match mean?
A 6% 401(k) match means that an employer is willing to match up to 6% of an employee’s total salary or compensation in their 401(k) account through matching contributions.
What is a good 401(k) match?
A good 401(k) match could be in the 3% to 6% range, as average employer matches tend to be between 4% and 5%.
Is a 3% match good? Is a 4% match good?
Generally speaking, a 3% match could be considered “good,” as could a 4% match. On average, employers match somewhere between 4% and 5%, and when you get down to it, almost any employer match is “good.”
How do I maximize my 401(k) match?
Maximizing your 401(k) match involves contributing enough to get at least your employer’s full match, whatever that match may be. You should be able to change your contribution levels through your provider, or by speaking with your employer.
INVESTMENTS ARE NOT FDIC INSURED • ARE NOT BANK GUARANTEED • MAY LOSE VALUE
SoFi Invest is a trade name used by SoFi Wealth LLC and SoFi Securities LLC offering investment products and services. Robo investing and advisory services are provided by SoFi Wealth LLC, an SEC-registered investment adviser. Brokerage and self-directed investing products offered through SoFi Securities LLC, Member FINRA/SIPC.
For disclosures on SoFi Invest platforms visit SoFi.com/legal. For a full listing of the fees associated with Sofi Invest please view our fee schedule.
Financial Tips & Strategies: The tips provided on this website are of a general nature and do not take into account your specific objectives, financial situation, and needs. You should always consider their appropriateness given your own circumstances.
¹Probability of Member receiving $1,000 is a probability of 0.026%; If you don’t make a selection in 45 days, you’ll no longer qualify for the promo. Customer must fund their account with a minimum of $50.00 to qualify. Probability percentage is subject to decrease. See full terms and conditions.
SOIN0124014
CN-Q425-3236452-134
Q126-3525874-059
Read more
Retirement will likely be the most significant expense of your lifetime, which means saving for retirement is a big job. This is especially true if you envision a retirement that is rich with experiences such as traveling through Europe or spending time with your grown children and grandkids. A retirement savings plan may help you achieve these financial goals and stay on track.
There are all types of retirement plans you may consider to help you build your wealth, from 401(k)s to Individual Retirement Accounts (IRAs) to annuities. Understanding the nuances of these different retirement plans, like their tax benefits and various drawbacks, may help you choose the right mix of plans to achieve your financial goals.
Key Points
• There are various types of retirement plans, including traditional and non-traditional options, such as 401(k), IRA, Roth IRA, SEP IRA, and Cash-Balance Plan.
• Employers offer defined contribution plans (e.g., 401(k)) where employees contribute and have access to the funds, and defined benefit plans (e.g., Pension Plans) where employers invest for employees’ retirement.
• Different retirement plans have varying tax benefits, contribution limits, and employer matches, which should be considered when choosing a plan.
• Individual retirement plans like Traditional IRA and Roth IRA provide tax advantages but have contribution restrictions and penalties for early withdrawals.
• It’s possible to have multiple retirement plans, including different types and accounts of the same type, but there are limitations on tax benefits based on the IRS regulations.
🛈 SoFi does not offer employer-sponsored plans, such as 401(k) or 403(b) plans, but we do offer a range of individual retirement accounts (IRAs).
Types of Retirement Accounts
There are several different types of retirement plans, including some traditional plan types you may be familiar with as well as non-traditional options.
Traditional retirement plans can be IRA accounts or 401(k). These tax-deferred retirement plans allow you to contribute pre-tax dollars to an account. With a traditional IRA or 401(k), you only pay taxes on your investments when you withdraw from the account.
Non-traditional retirement accounts can include Roth 401(k)s and IRAs, for which you pay taxes on funds before contributing them to the account and withdraw money tax-free in retirement.
Here’s information about some of the most common retirement plan types:
There are typically two types of retirement plans offered by employers:
• Defined contribution plans (more common): The employee invests a portion of their paycheck into a retirement account. Sometimes, the employer will match up to a certain amount (e.g. up to 5%). In retirement, the employee has access to the funds they’ve invested. 401(k)s and Roth 401(k)s are examples of defined contribution plans.
• Defined benefit plans (less common): The employer invests money for retirement on behalf of the employee. Upon retirement, the employee receives a regular payment, which is typically calculated based on factors like the employee’s final or average salary, age, and length of service. As long as they meet the plan’s eligibility requirements, they will receive this fixed benefit (e.g. $100 per month). Pension plans and cash balance accounts are common examples of defined benefit plans.
Let’s get into the specific types of plans employers usually offer.
401(k) Plans
A 401(k) plan is a type of work retirement plan offered to the employees of a company. Traditional 401(k)s allow employees to contribute pre-tax dollars, where Roth 401(k)s allow after-tax contributions.
• Income Taxes: If you choose to make a pre-tax contribution, your contributions may reduce your taxable income. Additionally, the money will grow tax-deferred and you will pay taxes on the withdrawals in retirement. Some employers allow you to make after-tax or Roth contributions to a 401(k). You should check with your employer to see if those are options.
• Contribution Limit: $23,500 in 2025 and $24,500 in 2026 for the employee; people 50 and older can contribute an additional $7,500 in 2025 and $8,000 in 2026. However, in 2025 and 2026, under the SECURE 2.0 Act, a higher catch-up limit of $11,250 applies to individuals ages 60 to 63.
And under a new law that went into effect on January 1, 2026 (as part of SECURE 2.0), individuals aged 50 and older who earned more than $150,000 in FICA wages in 2025 are required to put their 401(k) catch-up contributions into a Roth 401(k) account. Because of the way Roth accounts work, these individuals will pay taxes on their catch-up contributions upfront, but can make eligible withdrawals tax-free in retirement.
• Pros: Money is deducted from your paycheck, automating the process of saving. Some companies offer a company match. There is a significantly higher limit than with Traditional IRA and Roth IRA accounts.
• Cons: With a 401(k) plan, you are largely at the mercy of your employer — there’s no guarantee they will pick plans that you feel are right for you or are cost effective for what they offer. Also, the value of a 401(k) comes from two things: the pre-tax contributions and the employer match, if your employer doesn’t match, a 401(k) may not be as valuable to an investor. There are also penalties for early withdrawals before age 59 ½, although there are some exceptions, including for certain public employees.
• Usually best for: Someone who works for a company that offers one, especially if the employer provides a matching contribution. A 401(k) retirement plan can also be especially useful for people who want to put retirement savings on autopilot.
• To consider: Sometimes 401(k) plans have account maintenance or other fees. Because a 401(k) plan is set up by your employer, investors only get to choose from the investment options they provide.
403(b) Plans
A 403(b) retirement plan is like a 401(k) for certain individuals employed by public schools, churches, and other tax-exempt organizations. Like a 401(k), there are both traditional and Roth 403(b) plans. However, not all employees may be able to access a Roth 403(b).
• Income Taxes: With a traditional 403(b) plan, you contribute pre-tax money into the account; the money will grow tax-deferred and you will pay taxes on the withdrawals in retirement. Additionally, some employers allow you to make after-tax or Roth contributions to a 403(b); the money will grow tax-deferred and you will not have to pay taxes on withdrawals in retirement. You should check with your employer to see if those are options.
• Contribution Limit: $23,500 in 2025 and $24,500 in 2026 for the employee; people 50 and older can contribute an additional $7,500 in 2025 and $8,000 in 2026. In 2025 and 2026, under the SECURE 2.0 Act, those ages 60 to 63 can contribute a higher catch-up amount of $11,250. As noted above with 401(k) plans, as of January 1, 2026, individuals aged 50 and older with FICA wages exceeding $150,000 in 2025 are required to put their catch-up contributions into a Roth account.
The maximum combined amount both the employer and the employee can contribute annually to the plan (not including the catch-up amounts) is generally the lesser of $70,000 in 2025 and $72,000 in 2026 or the employee’s most recent annual salary.
• Pros: Money is deducted from your paycheck, automating the process of saving. Some companies offer a company match. Also, these plans often come with lower administrative costs because they aren’t subject to Employee Retirement Income Security Act (ERISA) oversight.
• Cons: A 403(b) account generally lacks the same protection from creditors as plans with ERISA compliance.
• To consider: 403(b) plans offer a narrow choice of investments compared to other retirement savings plans. The IRS states these plans can only offer annuities provided through an insurance company and a custodial account invested in mutual funds.
Solo 401(k) Plans
A Solo 401(k) plan is essentially a one-person 401(k) plan for self-employed individuals or business owners with no employees, in which you are the employer and the employee. Solo 401(k) plans may also be called a Solo-k, Uni-k, or One-participant k.
• Income Taxes: The contributions made to the plan are tax-deductible.
• Contribution Limit: $23,500 in 2025 and $24,500 in 2026, or 100% of your earned income, whichever is lower, plus “employer” contributions of up to 25% of your compensation from the business. The 2025 total cannot exceed $70,000, and the 2026 total cannot exceed $72,000. (On top of that, people 50 and older are allowed to contribute an additional $7,500 in 2025 and $8,000 in 2026. In 2025 and 2026, those ages 60 to 63 can contribute a higher catch-up amount of $11,250 under the SECURE 2.0 Act .)
• Pros: A solo 401(k) retirement plan allows for large amounts of money to be invested with pre-tax dollars. It provides some of the benefits of a traditional 401(k) for those who don’t have access to a traditional employer-sponsored 401(k) retirement account.
• Cons: You can’t open a solo 401(k) if you have any employees (though you can hire your spouse so they can also contribute to the plan as an employee — and you can match their contributions as the employer).
• Usually best for: Self-employed people with enough income and a large enough business to fully use the plan.
SIMPLE IRA Plans (Savings Incentive Match Plans for Employees)
A SIMPLE IRA plan is set up by an employer, who is required to contribute on employees’ behalf, although employees are not required to contribute.
• Income Taxes: Employee contributions are made with pre-tax dollars. Additionally, the money will grow tax-deferred and employees will pay taxes on the withdrawals in retirement.
• Contribution Limit: $16,500 in 2025 and $17,000 in 2026. Employees aged 50 and over can contribute an extra $3,500 in 2025 and $4,000 in 2026, bringing their total to $20,000 in 2025 and $21,000 in 2026. In 2025 and 2026, under the SECURE 2.0 Act, people ages 60 to 63 can contribute a higher catch-up amount of $5,250.
• Pros: Employers contribute to eligible employees’ retirement accounts at 2% their salaries, whether or not the employees contribute themselves. For employees who do contribute, the company will match up to 3%.
• Cons: The contribution limits for employees are lower than in a 401(k) and the penalties for early withdrawals — up to 25% for withdrawals within two years of your first contribution to the plan — before age 59 ½ may be higher.
• To consider: Only employers with less than 100 employees are allowed to participate.
This is a retirement account established by a small business owner or self-employed person for themselves (and if applicable, any employees).
• Income Taxes: Your contributions will reduce your taxable income. Additionally, the money will grow tax-deferred and you will pay taxes on withdrawals in retirement.
• Contribution Limit: For 2025, $70,000 or 25% of earned income, whichever is lower; for 2026, $72,000 or 25% of earned income, whichever is lower.
• Pros: Higher contribution limit than IRA and Roth IRAs, and contributions are tax deductible for the business owner.
• Cons: These plans are employer contribution only and greatly rely on the financial wherewithal and available cash of the business itself.
• Usually best for: Self-employed people and small business owners who wish to contribute to an IRA for themselves and/or their employees.
• To consider: Because you’re setting up a retirement plan for a business, there’s more paperwork and unique rules. When opening an employer-sponsored retirement plan, it generally helps to consult a tax advisor.
Profit-Sharing Plans (PSPs)
A Profit-Sharing Plan is a retirement plan funded by discretionary employer contributions that gives employees a share in the profits of a company.
• Income taxes: Deferred; assessed on distributions from the account in retirement.
• Contribution Limit: The lesser of 25% of the employee’s compensation or $70,000 in 2025 (On top of that, people 50 and older are allowed to contribute an additional $7,500 in 2025. And people ages 60 to 63 can make a higher contribution of $11,250 in 2025 under SECURE 2.0.) In 2026, the contribution limit is $72,000 or 25% of the employee’s compensation, whichever is less. Those 50 and up can contribute an extra $7,500 in 2025 and $8,000 in 2026. And people ages 60 to 63 can once again make a higher contribution of $11,250 in 2026 under SECURE 2.0.
• Pros: An employee receives a percentage of a company’s profits based on its earnings. Companies can set these up in addition to other qualified retirement plans, and make contributions on a completely voluntary basis.
• Cons: These plans put employees at the mercy of their employers’ profits, unlike retirement plans that allow employees to invest in securities issued by other companies.
• Usually best for: Companies who want the flexibility to contribute to a PSP on an ad hoc basis.
• To consider: Early withdrawal from the plan is subject to penalty.
Defined Benefit Plans (Pension Plans)
These plans, more commonly known as pension plans, are retirement plans provided by the employer where an employee’s retirement benefits are calculated using a formula that factors in age, salary, and length of employment.
• Income taxes: Deferred; assessed on distributions from the plan in retirement.
• Contribution limit: Determined by an enrolled actuary and the employer.
• Pros: Provides tax benefits to both the employer and employee and provides a fixed payout upon retirement that many retirees find desirable.
• Cons: These plans are increasingly rare, but for those who do have them, issues can include difficulty realizing or accessing benefits if you don’t work at a company for long enough.
• Usually best for: Companies that want to provide their employees with a “defined” or pre-determined benefit in their retirement years.
• To consider: These plans are becoming less popular because they cost an employer significantly more in upkeep than a defined contribution plan such as a 401(k) program.
Employee Stock Ownership Plans (ESOPs)
An Employee Stock Ownership Plan is a qualified defined contribution plan that invests in the stock of the sponsoring employer.
• Income taxes: Deferred. When an employee leaves a company or retires, they receive the fair market value for the stock they own. They can either take a taxable distribution or roll the money into an IRA.
• Contribution limits: Allocations are made by the employer, usually on the basis of relative pay. There is typically a vesting schedule where employees gain access to shares in one to six years.
• Pros: Could provide tax advantages to the employee. ESOP plans also align the interests of a company and its employees.
• Cons: These plans concentrate risk for employees: An employee already risks losing their job if an employer is doing poorly financially, by making some of their compensation employee stock, that risk is magnified. In contrast, other retirement plans allow an employee to invest in stocks in other securities that are not tied to the financial performance of their employer.
457(b) Plans
A 457(b) retirement plan is an employer-sponsored deferred compensation plan for employees of state and local government agencies and some tax-exempt organizations.
• Income taxes: If you choose to make a pre-tax contribution, your contributions will reduce your taxable income. Additionally, the money will grow tax-deferred and you will pay taxes on the withdrawals in retirement. Some employers also allow you to make after-tax or Roth contributions to a 401(k).
• Contribution limits: The lesser of 100% of employee’s compensation or $23,500 in 2025 and $24,500 in 2026; some plans allow for “catch-up” contributions. For those plans that do allow catch-ups, under the new law that went into effect on January 1, 2026, individuals aged 50 and older with FICA wages above $150,000 in 2025 are required to put their catch-up contributions into a Roth account.
• Pros: Plan participants can withdraw as soon as they are retired at any age, they do not have to wait until age 59 ½ as with 401(k) and 403(b) plans.
• Cons: 457 plans do not have the same kind of employer match as a 401(k) plan. While employers can contribute to the plan, it’s only up to the combined limit for individual contributions.
• Usually best for: Employees of governmental agencies.
Federal Employees Retirement System (FERS)
The Federal Employees Retirement System (FERS) consists of three government-sponsored retirement plans: Social Security, the Basic Benefit Plan, and the Thrift Savings Plan.
The Basic Benefit Plan is an employer-provided pension plan, while the Thrift Savings Plan is most comparable to what private-sector employees can receive.
• Income Taxes: Contributions to the Thrift Savings Plan are made before taxes and grow tax-free until withdrawal in retirement.
• Contribution Limit: The contribution limit for employees is $23,500 in 2025, and the combined limit for all contributions, including from the employer, is $70,000. In 2026, the employee contribution limit is $24,500, and the combined limit for contributions, including those from the employer, is $72,000. Also, those 50 and over are eligible to make an additional $7,500 in “catch-up” contributions in 2025 and an additional $8,000 in 2026. And in both 2025 and 2026, those ages 60 to 63 can make a higher catch-up contribution of $11,250 under the SECURE 2.0 Act.
• Pros: These government-sponsored plans are renowned for their low administrative fees and employer matches.
• Cons: Only available for federal government employees.
• Usually best for: Federal government employees who will work at their agencies for a long period; it is comparable to 401(k) plans in the private sector.
Cash-Balance Plans
This is another type of pension plan that combines features of defined benefit and defined contribution plans. They are sometimes offered by employers that previously had defined benefit plans. The plans provide an employee an “employer contribution equal to a percent of each year’s earnings and a rate of return on that contribution.”
• Income Taxes: Contributions come out of pre-tax income, similar to 401(k).
• Contribution Limit: The plans combine a “pay credit” based on an employee’s salary and an “interest credit” that’s a certain percentage rate; the employee then gets an account balance worth of benefits upon retirement that can be paid out as an annuity (payments for life) or a lump sum. Limits depend on age, but for those over 60, they can be more than $250,000.
• Pros: Can reduce taxable income.
• Cons: Cash-balance plans have high administrative costs.
• Usually best for: High earners, business owners with consistent income.
Nonqualified Deferred Compensation Plans (NQDC)
These are plans typically designed for executives at companies who have maxed out other retirement plans. The plans defer payments — and the taxes — you would otherwise receive as salary to a later date.
• Income Taxes: Income taxes are deferred until you receive the payments at the agreed-upon date.
• Contribution Limit: None
• Pros: The plans don’t have to be entirely geared around retirement. While you can set dates with some flexibility, they are fixed.
• Cons: Employees are not usually able to take early withdrawals.
• Usually best for: Highly-paid employees for whom typical retirement plans would not provide enough savings compared to their income.
Multiple Employer Plans
A multiple employer plan (MEP) is a retirement savings plan offered to employees by two or more unrelated employers. It is designed to encourage smaller businesses to share the administrative burden of offering a tax-advantaged retirement savings plan to their employees. These employers pool their resources together to offer a defined benefit or defined contribution plan for their employees.
Administrative and fiduciary responsibilities of the MEP are performed by a third party (known as the MEP Sponsor), which may be a trade group or an organization that specializes in human resources management.
This article is part of SoFi’s Retirement Planning Guide, our coverage of all the steps you need to create a successful retirement plan.
Compare Types of Retirement Accounts Offered by Employers
To recap retirement plans offered by employers:
Retirement Plans Offered by Employers
Type of Retirement Plan
May be Funded By
Pro
Con
401(k)
Employee and Employer
Contributions are deducted from paycheck
Limited investment options
Solo 401(k)
Employee and Employer
Good for self-employed people
Not available for business owners that have employees
403(b)
Employee and Employer
Contributions are deducted from paycheck
Usually offer a narrow choice of investment options
SIMPLE IRA
Employer and Employee
Employer contributes to account
High penalties for early withdrawals
SEP Plan
Employer
High contribution limits
Employer decides whether and how much to contribute each year
Profit-Sharing Plan
Employer
Can be paired with other qualified retirement plans
Plan depends on an employer’s profits
Defined Benefit Plan
Employer
Fixed payout upon retirement
May be difficult to access benefits
Employee Stock Ownership Plan
Employer
Aligns interest of a company and its employees
May be risky for employees
457
Employee
You don’t have to wait until age 59 ½ to withdraw
Does not have same employer match possibility like a 401(k)
Federal Employees Retirement System
Employee and Employer
Low administrative fees
Only available for federal government employees
Cash-Balance Plan
Employer
Can reduce taxable income
High administrative costs
Nonqualified Deferred Compensation Plan
Employer
Don’t have to be retirement focused
Employees are not usually able to take early withdrawals
With an IRA, you open and fund the IRA yourself. As the name suggestions, it is a retirement plan for individuals. This is not a plan you join through an employer.
• Income Taxes: You may receive an income tax deduction on contributions (depending on your income and access to another retirement plan through work). The balance in the IRA is tax-deferred, and withdrawals will be taxed (the amount will vary depending on whether contributions were deductible or non-deductible).
• Contribution Limit: In 2025, the contribution limit is $7,000, or $8,000 for people 50 and older. In 2026, the contribution limit is $7,500, or $8,600 for people 50 and older.
• Pros: You might be able to lower your tax bill if you’re eligible to make deductible contributions. Additionally, the money in the account is tax-deferred, which can make a difference over a long period of time. Finally, there are no income limits for contributing to a traditional IRA..
• Cons: Traditional IRAs come with a number of restrictions, including how much can be contributed and when you can start withdrawals without penalty. Traditional IRAs are also essentially a guess on the tax rate you will be paying when you begin withdrawals after age 59 ½, as the money in these accounts are tax-deferred but are taxed upon withdrawal. Also, traditional IRAs generally mandate withdrawals starting at age 73.
• Usually best for: People who can make deductible contributions and want to lower their tax bill, or individuals who earn too much money to contribute directly to a Roth IRA. Higher-income earners might not get to deduct contributions from their taxes now, but they can take advantage of tax-deferred growth between now and retirement. An IRA can also be used for consolidating and rolling over 401(k) accounts from previous jobs.
• To consider: You may be subject to a 10% penalty for withdrawing funds before age 59 ½. As a single filer, you cannot deduct IRA contributions if you’re already covered by a retirement account through your work and earn more (according to your modified gross adjusted income) than $89,000 or more in 2025, with a phase-out starting at more than $79,000, and $91,000 or more in 2026, with a phase-out starting at more than $81,000.
Roth IRAs
A Roth IRA is another retirement plan for individuals that is managed by the account holder, not an employer.
• Income Taxes: Roth IRA contributions are made with after-tax money, which means you won’t receive an income tax deduction for contributions. But your balance will grow tax-free and you’ll be able to withdraw the money tax-free in retirement.
• Contribution Limit: In 2025, the contribution limit is $7,000, or $8,000 for those 50 and up. In 2026, the contribution limit is $7,500, or $8,600 for those 50 and up.
• Pros: While contributing to a Roth IRA won’t lower your tax bill now, having the money grow tax-free and being able to withdraw the money tax-free down the road could provide value in the future.
• Cons: Like a traditional IRA, a Roth IRA has tight contribution restrictions. Unlike a traditional IRA, it does not offer tax deductions for contributions. As with a traditional IRA, there’s a penalty for taking some kinds of distributions before age 59 ½.
• Usually best for: Someone who wants to take advantage of the flexibility to withdraw from an account during retirement without paying taxes. Additionally, it can be especially beneficial for people who are currently in a low income-tax bracket and expect to be in a higher income tax bracket in the future.
• To consider: To contribute to a Roth IRA, you must have an earned income. Your ability to contribute begins to phase out when your income as a single filer (specifically, your modified adjusted gross income) reaches $150,000 in 2025, and $153,000 in 2026. As a married joint filer, your ability to contribute to a Roth IRA begins to phase out at $236,000 in 2025, and $242,000 in 2026.
Payroll Deduction IRAs
This is either a traditional or Roth IRA that is funded through payroll deductions.
• Income Taxes: For a Traditional IRA, you may receive an income tax deduction on contributions (depending on income and access to a retirement plan through work); the balance in the IRA will always grow tax-deferred, and withdrawals will be taxed (how much is taxed depends on if you made deductible or non-deductible contributions). For a Roth IRA, contributions are made with after-tax money, your balance will grow tax-free and you’ll be able to withdraw the money tax-free in retirement.
• Contribution Limit: In 2025, the limit is $7,000, or $8,000 for those 50 and older. In 2026, the limit is $7,500, or $8,600 for those 50 and older.
• Pros: Automatically deposits money from your paycheck into a retirement account.
• Cons: The employee must do the work of setting up a plan, and employers can not contribute to it as with a 401(k). Participants cannot borrow against the retirement plan or use it as collateral for loans.
• Usually best for: People who do not have access to another retirement plan through their employer.
• To consider: These have the same rules as a Traditional IRA, such as a 10% penalty for withdrawing funds before age 59 ½. Only employees can contribute to a Payroll Deduction IRA.
Guaranteed Income Annuities (GIAs)
Guaranteed Income Annuities are products sold by insurance companies. They are similar to the increasingly rare defined benefit pensions in that they have a fixed payout that will last until the end of life. These products are generally available to people who are already eligible to receive payouts from their retirement plans.
• Income Taxes: If the annuity is funded by 401(k) benefits, then it is taxed like income. Annuities purchased with Roth IRAs, however, have a different tax structure. For “non-qualified annuities,” i.e. annuities purchased with after-tax income, a formula is used to determine the taxes so that the earnings and principal can be separated out.
• Contribution Limit: Annuities typically do not have contribution limits.
• Pros: These are designed to allow for payouts until the end of life and are fixed, meaning they’re not dependent on market performance.
• Cons: Annuities can be expensive, often involving significant fees or commissions.
• Usually best for: People who have high levels of savings and can afford to make expensive initial payments on annuities.
Cash-Value Life Insurance Plan
Cash-value life insurance typically covers the policyholder’s entire life and has tax-deferred savings, making it comparable to other retirement plans. Some of the premium paid every month goes to this investment product, which grows over time.
• Income Taxes: Taxes are deferred until the policy is withdrawn from, at which point withdrawals are taxed at the policyholder’s current income tax rate.
• Contribution Limit: The plan is drawn up with an insurance company with set premiums.
• Pros: These plans have a tax-deferring feature and can be borrowed from.
• Cons: While you may be able to withdraw money from the plan, this will reduce your death benefit.
• Usually best for: High earners who have maxed out other retirement plans.
Compare Types of Retirement Accounts Not Offered by Employers
To recap retirement plans not offered by employers:
Retirement Plans Not Offered by Employers
Type of Retirement Plan
Pro
Con
IRA
Contributions may be tax deductible
Penalty for withdrawing funds before age 59 ½
Roth IRA
Distributions are not taxed
Not available for individuals with high incomes
Payroll Deduction IRA
Automatically deposits money from your paycheck into the account
Participants can’t borrow against the plan
Guaranteed Income Annuity
Not dependent on market performance
Expensive fees and commissions
Cash-Value Life Insurance Plan
Tax-deferred savings
May be able to withdraw money from the plan, but this will reduce death benefit
Specific Benefits to Consider
As you’re considering the different types of retirement plans, it’s important to look at some key benefits of each plan. These include:
• the tax advantage
• contribution limits
• whether an employer will add funds to the account
• any fees associated with the account
💡 Quick Tip: Before opening any investment account, consider what level of risk you are comfortable with. If you’re not sure, start with more conservative investments, and then adjust your portfolio as you learn more.
Determining Which Type of Retirement Plan Is Best for You
Depending on your employment circumstances, there are many possible retirement plans in which you can invest money for retirement. Some are offered by employers, while other retirement plans can be set up by an individual. Brian Walsh, a CFP® at SoFi, says “a mixture of different types of accounts help you best plan your retirement income strategy down the road.”
Likewise, the benefits for each of the available retirement plans differ. Here are some specific benefits and disadvantages of a few different plans to consider.
With employer-offered plans like a 401(k) and 403(b), you have the ability to:
Take them with you. If you leave your job, you can roll these plans over into a plan with a new employer or an IRA.
Possibly get an employer match. With some of these plans, an employer may match a certain percentage or amount of your contributions.
With retirement plans not offered by employers, like a SEP IRA, you may get:
A wider variety of investment options. You might have more options to choose from with these plans.
You may be able to contribute more. The contribution limits for some of these plans may be higher.
Despite their differences, the many different types of retirement accounts all share one positive attribute: utilizing and investing in them is an important step in saving for retirement.
Because there are so many retirement plans to choose from, it may be wise to talk to a financial professional to help you decide your financial plan.
Can You Have Multiple Types of Retirement Plans?
You can have multiple retirement savings plans, whether employer-provided plans like a 401(k), IRAs, or annuities. Having various plans can let you take advantage of the specific benefits that different retirement savings plans offer, thus potentially increasing your total retirement savings.
Additionally, you can have multiple retirement accounts of the same type; you may have a 401(k) at your current job while also maintaining a 401(k) from your previous employer.
Nonetheless, there are limitations on the tax benefits you may be allowed to receive from these multiple retirement plans. For example, the IRS does not allow individuals to take a tax deduction for traditional IRA contributions if they also have an employer-sponsored 401(k).
Opening a Retirement Investment Account With SoFi
Prepare for your retirement with an individual retirement account (IRA). It’s easy to get started when you open a traditional or Roth IRA with SoFi. Whether you prefer a hands-on self-directed IRA through SoFi Securities or an automated robo IRA with SoFi Wealth, you can build a portfolio to help support your long-term goals while gaining access to tax-advantaged savings strategies.
Easily manage your retirement savings with a SoFi IRA.
FAQ
Why is it important to understand the different types of retirement plans?
Understanding the different types of retirement plans is important because of the nuances of taxation in these accounts. The various rules imposed by the Internal Revenue Service (IRS) can affect your contributions, earnings, and withdrawals. And not only does the IRS have rules around taxation, but also about contribution limits and when you can withdraw money without penalties.
Additionally, the various types of retirement plans differ regarding who establishes and uses each account and the other plan rules. Ultimately, understanding these differences will help you determine which combination of retirement plans is best for you.
How can you determine which type of retirement plan is best for you?
The best type of retirement plan for you is the one that best meets your needs. Many types of retirement plans are available, and each has its own benefits and drawbacks. When choosing a retirement plan, some factors to consider include your age, investing time horizon, financial goals, risk tolerance, and the fees associated with a retirement plan.
Photo credit: iStock/damircudic
INVESTMENTS ARE NOT FDIC INSURED • ARE NOT BANK GUARANTEED • MAY LOSE VALUE
SoFi Invest is a trade name used by SoFi Wealth LLC and SoFi Securities LLC offering investment products and services. Robo investing and advisory services are provided by SoFi Wealth LLC, an SEC-registered investment adviser. Brokerage and self-directed investing products offered through SoFi Securities LLC, Member FINRA/SIPC.
For disclosures on SoFi Invest platforms visit SoFi.com/legal. For a full listing of the fees associated with Sofi Invest please view our fee schedule.
Financial Tips & Strategies: The tips provided on this website are of a general nature and do not take into account your specific objectives, financial situation, and needs. You should always consider their appropriateness given your own circumstances.
Tax Information: This article provides general background information only and is not intended to serve as legal or tax advice or as a substitute for legal counsel. You should consult your own attorney and/or tax advisor if you have a question requiring legal or tax advice.
Third Party Trademarks: Certified Financial Planner Board of Standards Center for Financial Planning, Inc. owns and licenses the certification marks CFP®, CERTIFIED FINANCIAL PLANNER®
Mutual Funds (MFs): Investors should carefully consider the information contained in the prospectus, which contains the Fund’s investment objectives, risks, charges, expenses, and other relevant information. You may obtain a prospectus from the Fund company’s website or clicking the prospectus link on the fund's respective page at sofi.com. You may also contact customer service at: 1.855.456.7634. Please read the prospectus carefully prior to investing.Mutual Funds must be bought and sold at NAV (Net Asset Value); unless otherwise noted in the prospectus, trades are only done once per day after the markets close. Investment returns are subject to risk, include the risk of loss. Shares may be worth more or less their original value when redeemed. The diversification of a mutual fund will not protect against loss. A mutual fund may not achieve its stated investment objective. Rebalancing and other activities within the fund may be subject to tax consequences.
When markets are volatile, and you start to see your portfolio shrink, there may be an impulse to pull your money out and put it somewhere safe — but acting on that desire may actually expose you to a higher level of risk. In fact, there’s a whole field of research devoted to investor behavior, and the financial consequences of following your emotions (hint: the results are less than ideal).
A better strategy might be to anticipate your own natural reactions when markets drop, or when there’s a stock market crash, and wait to make investment choices based on more rational thinking (or even a set of rules you’ve set up for yourself in advance). After all, for many investors — especially those with longer time horizons — time in the market often beats timing the stock market. Here’s an overview of factors investors might weigh when deciding whether to keep money in the stock market.
Key Points
• Acting on emotions during market volatility may expose investors to higher risk and potentially lead to missed opportunities.
• Time in the market often beats timing the market, especially for investors with a longer time horizon.
• Legitimate reasons to sell investments include reaching a financial goal, needing cash for a near-term expense, or a change in an investment’s fundamentals.
• Selling based on fear can result in locking in losses and missing potential market rebounds.
• Alternatives to selling everything include rebalancing a portfolio, reviewing diversification, and reassessing long-term asset allocation.
Why Market Volatility Can Be So Stressful
An emotion-guided approach to the stock market, whether it’s the sudden offloading or purchasing of stocks, can stem from an attempt to predict the short-term movements in the market.
This approach is called timing the market. And while the notion of trying to predict the perfect time to buy or sell is a familiar one, investors are also prone to specific behaviors or biases that can expose them to further risk of losses.
When markets experience a sharp decline, some investors might feel tempted to give in to FUD (fear, uncertainty, doubt). Investors might assume that by selling now they’re shielding themselves from further losses.
This logic, however, presumes that investing in a down market means the market will continue to go down, which — given the volatility of prices and the impossibility of knowing the future — may or may not be the case.
Focusing on temporary declines might compel some investors to make hasty decisions that they may later regret. After all, over time, markets tend to correct.
Likewise, when the market is moving upwards, investors can sometimes fall victim to what’s known as FOMO (fear of missing out) — buying under the assumption that today’s growth is a sign of tomorrow’s continued boom. That strategy is not guaranteed to yield success either.
The Case for Staying Invested: Time in the Market
Whether you should sell your assets and pull money out of the market will depend on an investor’s time horizon, or, the length of time they aim to hold an investment before selling.
Many industry studies have shown that time in the market is typically a wiser approach versus trying to time the stock market or give in to panic selling.
One such groundbreaking study by Brad Barber and Terence Odean was called, “Trading Is Hazardous to Your Wealth: The Common Stock Investment Performance of Individual Investors.”
It was published in April 2000 in the Journal of Finance, and it was one of the first studies to quantify the gap between market returns and investor returns.
• Market returns are simply the average return of the market itself over a specific period of time.
• Investor returns, however, are what the average investor tends to reap — and investor returns are significantly lower, the study found, particularly among those who trade more often.
In other words, when investors try to time the market by selling on the dip and buying on the rise, they may actually lose out.
Get up to $1,000 in stock when you fund a new Active Invest account.*
Access stock trading, options, alternative investments, IRAs, and more. Get started in just a few minutes.
*Customer must fund their Active Invest account with at least $50 within 45 days of opening the account. Probability of customer receiving $1,000 is 0.026%. See full terms and conditions.
The Biggest Risk of Selling: Missing the Market’s Best Days
By contrast, keeping money in the market for a long period of time can help cut the risk of short-term dips or declines in stock pricing. Staying put despite periods of volatility, for some investors, could be a sound strategy.
An investor’s time horizon may play a significant role in determining whether or not they might want to get out of the stock market. Generally, the longer a period of time an investor has to ride out the market, the less they may want to fret about their portfolio during upheaval.
Compare, for instance, the scenario of a 25-year-old who has decades to make back short-term losses versus someone who is about to retire and needs to begin taking withdrawals from their investment accounts.
And by staying invested, investors will experience both downturns and upswings. If they do sell, though, they’d have locked in their losses and could miss out on a potential market recovery.
3 Legitimate Reasons to Sell Your Investments
There are some reasonable situations in which an investor might sell their investments and walk away from the markets. Those could include the following.
You’ve Reached Your Financial Goal
If you’ve reached your financial goal, whatever that is, you may very well sleep better at night by taking your money out of the market and holding cash, though some investors may want to keep at least some money invested in one way or another. Again, this depends completely upon whether you’ve reached your goal, and don’t have any others that you may be working toward.
You Need to Cash for a Near-term Expense
If you need some cash to make a big purchase like a home or a vehicle, or maybe even for an emergency, you could consider the possibility of selling some of your investments. This may set you back a bit in reaching your goals, but the more immediate need may be more pressing.
The Investment’s Fundamentals Have Changed
It may also be time to sell if an investment’s fundamentals have changed. For instance, if you own several shares of Stock X, and Stock X’s revenue has taken a large dip for several consecutive quarters due to its products losing market share, it may be time to reallocate. There can be many reasons that could affect the investment’s fundamentals, and any one of them could be cause to sell.
The Downsides of Selling Based on Fear
There are a few disadvantages to pulling cash out of the market during a downturn.
You Could Lock in Your Losses
First, as discussed earlier, there’s the risk of locking in losses if you sell your holdings too quickly. It’s as simple as that: Selling your investments based on an emotional, fear-based reaction to the markets could mean you lock in a negative return.
It’s Nearly Impossible to Time the Market Correctly
While you could lock in your losses, you could, again, miss a potential rebound as well. Locking in losses and then losing out on gains basically acts as a double loss. When you realize certain losses, as when you realize gains, you will likely have to deal with certain tax consequences.
And while moving to cash may feel safe, because you’re unlikely to see sudden declines in your cash holdings, the reality is that keeping money in cash increases the risk of inflation.
Alternatives to Selling Everything
Here’s an overview of some alternatives to getting out of the stock market:
1. Rebalance Your Portfolio
Investors could choose to rotate some of their investments into less risky assets (i.e,. those that aren’t correlated with market volatility). Gold, silver, and bonds are often thought of as some of the safe havens that investors first flock to during times of uncertainty.
By rebalancing a portfolio so fewer holdings are impacted by market volatility, investors might reduce the risk of loss.
Reassessing where to allocate one’s assets is no simple task and, if done too rashly, could lead to losses in the long run. So, it may be helpful for investors to speak with a financial professional before making a big investment change that’s driven by the news of the day.
Sometimes, astute investors also choose to rebalance their portfolio in a downturn — by buying new stocks. It may be possible — if challenging — to profit from new trends that sometimes emerge during a financial crisis.
It’s worth noting that this investment strategy doesn’t involve pulling money out of the stock market, it just means selling some stocks to buy others. Also, for newer investors or those with low risk tolerance, attempting this strategy might not be a desirable option.
2. Review Your Diversification
Instead of shifting investments into safe haven assets, like precious metals, some investors prefer to cultivate a well-diversified portfolio from the get-go.
In this case, there’d be less need to rotate funds towards less risky investments during a decline, as the portfolio would already offer enough diversification to help mitigate the risks of market volatility.
3. Reassess Your Long-term Asset Allocation
During downturns, it could be worthwhile for investors to examine their asset allocations — or, the amount of money an investor holds in each asset type.
If an investor holds stocks in industries that have been struggling and may continue to struggle due to floundering demand, for whatever reason, they may opt to sell some of the stocks that are declining in value.
Even if such holdings get sold at a loss, the investor could then put money earned from the sale of these stocks towards safe haven assets, potentially gaining back their recent losses. Whenever considering a bigger shift, however, it can be wise to discuss options with a financial advisor.
The Takeaway
Pulling money out of the market during a downturn is a natural impulse for many investors. After all, everyone wants to avoid losses. But attempting to time the market (when there’s no crystal ball) can be risky and stressful. For many investors, especially investors with a longer time horizon, keeping money in the stock market may carry advantages over time.
One approach to investing is to establish long-term investment goals and then strive to stay the course, even when facing market headwinds. As always, when it comes to investing in the stock market, there’s no guarantee of increasing returns. So, individual investors will want to examine their personal economic needs and short-term and future financial goals before deciding when and how to invest.
Invest in what matters most to you with SoFi Active Invest. In a self-directed account provided by SoFi Securities, you can trade stocks, exchange-traded funds (ETFs), mutual funds, alternative funds, options, and more — all while paying $0 commission on every trade. Other fees may apply. Whether you want to trade after-hours or manage your portfolio using real-time stock insights and analyst ratings, you can invest your way in SoFi's easy-to-use mobile app.
Opening and funding an Active Invest account gives you the opportunity to get up to $1,000 in the stock of your choice.¹
FAQ
In general, should I sell my stocks when the market is down?
Investors can sell their investments at any time, including when the market is down. Whether they should sell or not will depend on their goals and investment strategy, but generally, it’s likely more in line with most strategies to hold investments through downturns.
When is it smart to pull out of stocks?
It may be wise to pull out of stocks when you reach your financial goals, need cash for a short-term expense, or when a stock’s fundamentals have changed.
What are the tax implications of selling stocks?
Selling stocks triggers a taxable event, and investors will have a tax liability related to their capital gains. The rate will depend, in part, on how long they held the stock.
How long does it take to get my money after I sell investments?
There may be a short waiting period between when you get your money after you sell your investments. The length depends on the type of investment and your brokerage, but generally, it could take a day or two.
Instead of selling, should I invest more during a downturn?
One strategy during a market downturn includes buying more investments, which is sometimes called “buying the dip.” Some investors think of it as buying investments at a discount as values go down from previous highs.
INVESTMENTS ARE NOT FDIC INSURED • ARE NOT BANK GUARANTEED • MAY LOSE VALUE
SoFi Invest is a trade name used by SoFi Wealth LLC and SoFi Securities LLC offering investment products and services. Robo investing and advisory services are provided by SoFi Wealth LLC, an SEC-registered investment adviser. Brokerage and self-directed investing products offered through SoFi Securities LLC, Member FINRA/SIPC.
For disclosures on SoFi Invest platforms visit SoFi.com/legal. For a full listing of the fees associated with Sofi Invest please view our fee schedule.
¹Probability of Member receiving $1,000 is a probability of 0.026%; If you don’t make a selection in 45 days, you’ll no longer qualify for the promo. Customer must fund their account with a minimum of $50.00 to qualify. Probability percentage is subject to decrease. See full terms and conditions.
Investment Risk: Diversification can help reduce some investment risk. It cannot guarantee profit, or fully protect in a down market.
Tax Information: This article provides general background information only and is not intended to serve as legal or tax advice or as a substitute for legal counsel. You should consult your own attorney and/or tax advisor if you have a question requiring legal or tax advice.