How Midterm Elections Can Influence the Stock Market
Midterm elections can introduce uncertainty and turmoil to the stock market. A change in power in Congress could lead to policy and regulatory changes that could impact the economy and corporate profits. As such, investors will be watching to see which party wins control of Congress and the implications for the stock market.
Historically, the stock market has underperformed leading up to midterm elections and bounced back in the year following the elections. Many investors use this historical precedent to predict how midterms will affect the stock market in the future. However, past performance is not indicative of future results. The midterm elections may be less important on the stock market than other economic factors, like high interest rates, inflation, and rising energy costs.
What are the Midterm Elections?
As the name suggests, midterm elections occur in the middle of a presidential term, as opposed to a general election. Midterm elections are when voters elect every member of the House of Representatives, and about one-third of the members of the Senate. The results of the midterm elections often determine which political party controls the House and Senate, which could determine the future of economic policy that may affect the stock market, and investors’ plans for buying and selling stocks or other securities.
History of Midterm Elections Results
Historically, the president’s party loses ground in Congress during the midterm elections. Of the 22 midterm elections since 1934, the president’s party has lost an average of 28 seats in the House of Representatives and four in the Senate. The president’s party gained seats in both the House and the Senate only twice over this period.
The flip in power during the midterm elections occurs, in part, because the president’s approval rating usually declines during the first two years in office, which can influence voters to vote against the party in power or not show up to the polls. Additionally, voters of the party not in control are often more motivated to vote during these elections, boosting voter turnout that can help the opposition party outperform the president’s party.
During the most recent midterm election cycle, in 2022, the Republican party won the House of Representatives with a 222-213 seat majority. The Democratic Party maintained a majority in the Senate, with a 51-seat majority.
Stock Market Performance During Year of Midterm Elections
Leading up to the midterm elections, the stock market tends to underperform. Since 1962, the average annual return of the S&P 500 Index in the 12 months before midterm elections is 0.3%. In contrast, the historical average return of the S&P 500 is an 8.1% gain.
This underperformance during the midterm year follows the Presidential Election Cycle Theory, which implies that the first two years of a president’s term tend to be the weakest for the stocks.
However, it’s unclear whether this downbeat performance and stock volatility in the year preceding the midterms is a function of investors’ views of potential election outcomes and subsequent policy changes.
Some analysts say that the underperformance occurs due to uncertainty about the election’s outcome and impact, and investors don’t like uncertainty. But others say that the more critical impact on the stock market is the state of the economy; factors like the Federal Reserve’s monetary policy, energy prices, inflation, and the state of the labor market are more important to the stock market.
Recommended: How Do Interest Rates Impact Stocks?
Get up to $1,000 in stock when you fund a new Active Invest account.*
Access stock trading, options, alternative investments, IRAs, and more. Get started in just a few minutes.
Stock Market Performance Following Midterm Elections
Even though the stock market, as measured by the S&P 500, has historically underperformed leading up to the midterm elections, stocks have tended to overperform in the post-election environment. Between 1962 and 2022, the 12 months after midterm elections, the S&P 500 had an average return of 16.3%.
The gains in stocks following the midterm elections have occurred due to no single factor. One reason may be that investors prefer the certainty of knowing the makeup of the federal government and potential policy changes.
Moreover, some believe that because the president’s party typically loses ground in the midterm elections, it reduces the likelihood of policy changes that could have a negative impact on the economy. This, in turn, can provide a tailwind for stocks. The potential for gridlock, rather than sweeping policy and regulatory changes, is usually welcomed by investors.
How Did the 2022 Midterm Elections Affect the Stock Market?
It is always difficult to say how any midterm election cycle will affect the stock market. But we can look at the most recent midterm election, in 2022, to get a sense. Immediately following the election, on November 8, 2022, the S&P 500 did see an increase – but in December, the market later fell before gaining steam again in January.
So, it’s difficult to say how much the elections weighed on the markets, aside from other factors. During that time, for instance, rising inflation and interest rates may have been playing a larger role in the market’s performance than other variables.
But broadly and historically, again, the most obvious way the midterm elections could impact the markets is that if one party or the other gains control of Congress, that could influence economic policy and the country’s direction. This could lead to tax policy, regulation, and spending changes that could impact businesses and the stock market.
Another potential impact of the midterm elections is that if there is a change in control of Congress, that could lead to more investigations and subpoenas of businesses and individuals, which could create uncertainty that investors and the markets may not like.
The Takeaway
The history of midterm elections is one of cycles: the party in power typically loses ground during midterm elections, and the opposition party typically gains ground. And these cycles are also evident in the performance of the stock market, with muted stock gains in the year of a midterm election and substantial gains the year following the elections.
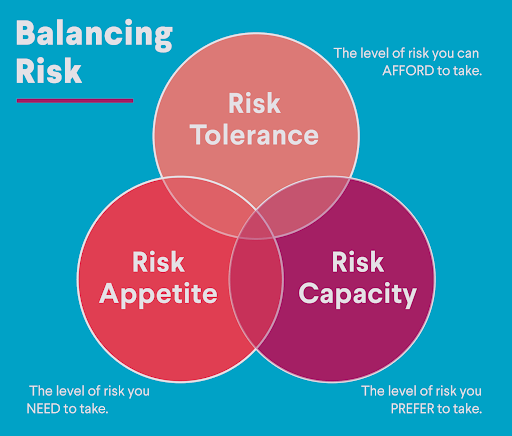
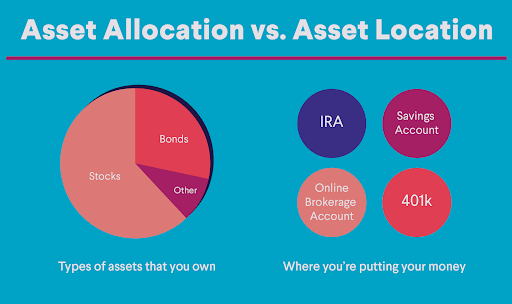
But despite these historical trends, no one can say for sure how the midterm elections will impact the stock market. And investors shouldn’t necessarily rely on these trends when making investing decisions. Instead, investors might want to try and maintain a long-term view to reach financial goals, avoiding the short-term noise and uncertainty of elections and politics. Investors should continue to focus on asset allocation, risk tolerance, and the time horizon of a diversified portfolio to achieve financial goals.
Invest in what matters most to you with SoFi Active Invest. In a self-directed account provided by SoFi Securities, you can trade stocks, exchange-traded funds (ETFs), mutual funds, alternative funds, options, and more — all while paying $0 commission on every trade. Other fees may apply. Whether you want to trade after-hours or manage your portfolio using real-time stock insights and analyst ratings, you can invest your way in SoFi's easy-to-use mobile app.
Opening and funding an Active Invest account gives you the opportunity to get up to $1,000 in the stock of your choice.¹
Photo credit: iStock/Drazen_
INVESTMENTS ARE NOT FDIC INSURED • ARE NOT BANK GUARANTEED • MAY LOSE VALUE
For disclosures on SoFi Invest platforms visit SoFi.com/legal. For a full listing of the fees associated with Sofi Invest please view our fee schedule.
Financial Tips & Strategies: The tips provided on this website are of a general nature and do not take into account your specific objectives, financial situation, and needs. You should always consider their appropriateness given your own circumstances.
¹Probability of Member receiving $1,000 is a probability of 0.026%; If you don’t make a selection in 45 days, you’ll no longer qualify for the promo. Customer must fund their account with a minimum of $50.00 to qualify. Probability percentage is subject to decrease. See full terms and conditions.
SOIN-Q324-028
Read more