Guide to the Average Savings in America by Age
Table of Contents
How much does the average American have in savings? Age tends to have a lot to do with it. Generally, as people get older, they are likely to have more savings.
But what the average person has in a savings account also depends on their financial goals and personal circumstances.
If you’re looking for a benchmark of just how much you should save by a specific age, or how much you should start contributing right now, read on for average savings by age and some tips that could help.
Key Points
• The average savings for individuals under 35 is $20,540.
• Individuals between the ages of 35 and 44 have an average savings of $41,540.
• Those aged 45 to 54 have an average savings of $71,130.
• The average savings for individuals between 55 and 64 is $72,520.
• Individuals aged 65 and older have an average savings of $100,2500.
The Importance of Saving for the Future
Life can happen fast. For example, the average cost of having a new baby is almost $19,000, including approximately $3,000 in out-of-pocket expenses for pregnancy and delivery. And then there’s the cost of caring for a child, which some estimates put at more than $310,605 for raising them through age 17.
And, if that baby wants to get a college degree, you’re looking at a whole new realm of savings. The cost of a four-year public college education can range from about $108,584 to $182,832, according to the Education Data Initiative.
There’s one other big reason to save for the future: People are living longer. According to a 2025 survey by the Employee Benefit Research Institute, only 28% of American workers are “very confident they will be able to retire comfortably.” Thirty-two percent of workers say their lack of confidence is because they have less than $25,000 in savings and investments.
Fortunately, the concept of saving for the future seems to be resonating with people at younger ages. According to the SoFi 2024 Retirement Survey, more than half (51%) of respondents started saving for retirement before age 35, with many of that group starting by age 25.
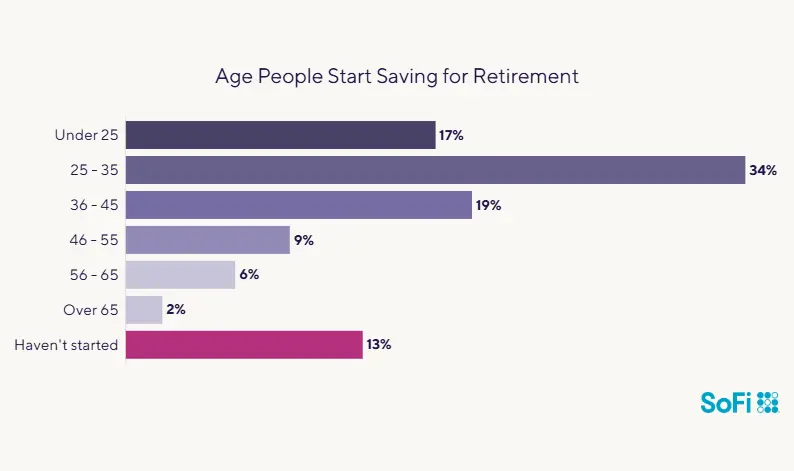
Source: SoFi 2024 Retirement Survey
A Savings Shortfall
Still, Americans’ savings strategy has a way to go. More than half of Americans can’t cover an unexpected $1,000 expense, according to Bankrate’s 2025 emergency savings report. Only 41% say they could cover it.
And 37% of all Americans don’t have enough cash in savings to cover even a $400 emergency, the Federal Reserve found in its “Economic Well-Being of U.S. Households in 2024” report.
Average Savings by Age in the USA
The Federal Reserve’s latest (2022) Survey of Consumer Finances shows that the typical American household has an average savings balance of $62,410.
But average savings varies greatly by age and number of people in a household. Here’s what savings by age looks like.
Average Savings for Those 35 and Younger
Americans under the age of 35 had an average savings account balance of $20,540, according to the Fed’s survey.
This is a large age bracket that can range from those just graduating high school to recent college grads to young professionals well into a decade’s worth of work.
It’s wise to have three to six months of expenses in an emergency fund. At the very least, aiming to have $1,000 handy in a savings account for unexpected expenses is recommended.
Use our emergency fund calculator to see how much you should ideally have stashed away.
For those who have started their careers, employer-sponsored retirement funds such as a 401(k) plan can be good options to start saving for long-term retirement goals.
It makes sense to contribute at least enough to get matching funds from an employer, if that’s an option with your company’s plan. For reference, the average 401(k) savings for those ages 25 to 34 is $42,640, according to Vanguard’s “How America Saves 2025” report.
Recommended: Why You Should Start Retirement Planning in Your 20s
Average Savings by Age: 35 to 44
Americans ages 35 to 44 had an average savings account balance of $41,540, according to the Federal Reserve survey. Those in this age bracket are now well into adulthood. At this stage of life, it’s prudent to have that three-to six-months’ worth of savings in an emergency fund, to cover the cost of everything from an accident to a lost job.
This may also be the time to think about diversifying a financial portfolio and possibly investing in the stock or bond market.
And, of course, keep contributing to your 401(k). For reference, the average 401(k) savings for those ages 35 to 44 is $103,552, according to the Vanguard report.
Average Savings by Age: 45 to 54
People ages 45 to 54 had an average savings account balance of $71,130, according to the Fed’s survey.
At this point, general financial advice dictates that a 50-year-old should have at least six times their annual salary if their intention is to retire at 67.
Those in this age group have an average 401(k) savings of $188,643.
Average Savings by Age: 55 to 64
The Fed survey found that Americans ages 55 to 64 had an average savings account balance of $72,520.
Since this is the time when most Americans are staring down retirement in a few years, it’s generally a good idea to boost retirement savings into high gear.
That’s because while younger people in 2025 are capped at contributing $23,500 a year to a 401(k) account, those age 50 and up are allowed to contribute an additional $7,500.This is known as a catch-up contribution. Also for 2026, those under age 50 can contribute up to $24,500, and those 50 and up can contribute an additional $8,000. And those aged 60 to 63 may again contribute an additional $11,250 instead of $8,000.
Under a new law that went into effect on January 1, 2026 (as part of SECURE 2.0), individuals aged 50 and older who earned more than $150,000 in FICA wages in 2025 are required to put their 401(k) catch-up contributions into a Roth 401(k) account. With Roth accounts, individuals pay taxes on contributions upfront, but can make qualified withdrawals tax-free in retirement.
The average retirement savings account for a person aged 55 to 64 is $271,230. It’s important to note that taking a withdrawal from such a plan before the age of 59 ½ could mean paying taxes and penalties.
Average Savings by Age: 65 and Older
This is when savings really peaks for the average American. The latest Federal Reserve Survey of Consumer Finances found that Americans ages 65 to 74 had an average savings account balance of $100,250.
However, that savings number does drop over time. According to the survey, Americans ages 75 and up had an average savings account balance of $82,800.
This underscores the importance of creating a retirement budget and sticking to it in order to have enough savings for as long as needed.
But before retirement, try to hit the average retirement savings amount for those ages 65 and up, which is $299,442.
This chart offers an at-a-glance comparison of the average American savings by age.
| Age | Average savings |
|---|---|
| Under 35 | $20,540 |
| 35-44 | $41,540 |
| 45-54 | $71,130 |
| 55-64 | $72,520 |
| 65+ | $100,250 |
Median Savings by Age
Median savings is different from average savings. The median is the number in the middle of all the other numbers, meaning half the numbers are higher and half are lower. So with median savings, half the people in an age category will have saved more and half will have saved less.
These are the median savings by age, according to the latest Federal Reserve Survey of Consumer Finances:
• Under 35: $5,400
• 35-44: $7,500
• 45-54: $8,700
• 55-64: $8,000
• 65-74: $13,400
Savings vs Retirement Savings
What Americans have saved for emergencies, expenses, and other near-future goals is different from what they have in their retirement savings accounts, as you can see from all the information above. It’s critical to have both types of savings at the same time.
And keep this in mind: As you get older, and closer to retirement, it’s important that your retirement savings grow even more. It’s a good idea to contribute the maximum amount allowed to your retirement accounts at this time, if you can. This is one of the ways to save for retirement.
Saving a Little Bit More
Reaching specific savings goals doesn’t have to be complicated. It just means doing a bit of homework, strategizing, and staying diligent about personal finances.
The first step in saving more is to analyze current expenses to see what can be cut back on or cut out altogether to make more room for saving. This means creating a personal budget and tracking current spending.
To track spending, a person could create an excel spreadsheet and list all expenditures by categories like groceries, phone bill, car expenses, housing, medical, entertainment and others over the course of a month, filling it in with every single dollar spent to see where the money is going. Or you can use an online tracker like SoFi’s tracker, which allows users to connect all their accounts to one dashboard and track spending habits in real time.
After the month is up, the next step is to look back on the expenditures list. Was there anything that surprised you? Do you need all those streaming subscriptions? How about that gym membership — did it actually get used? This is the time to get a little ruthless.
After figuring out what’s left, try implementing a general budget outline like the 50/30/20 rule. This means that approximately 50% of your after-tax income goes toward essential expenses like food and rent, while 30% goes toward discretionary expenses like nights out at the movies or concerts. The last 20% belongs to savings and retirement account goals.
Next, it’s time to get creative about saving even more for the future. This can be done by putting more cash into a high-yield savings account via direct deposit right from a paycheck.
Those looking to save a few more bucks every month could also do so by getting rid of unnecessary expenses. But, instead of pocketing that cash, consider using mobile banking to direct that cash right to savings.
Still feeling the pinch and don’t really have room to save more from a budget? Working part-time for, say, a ride-sharing company could allow you to set your own hours and earn extra income based on how much time you can dedicate to it. Other options might include freelance work in photography, writing, or other creative arts.
The Takeaway
Saving for goals in the near term — such as a house or a car — along with putting away money for an emergency savings fund to cover unexpected expenses, is important at every age. And so is investing in your future, including for retirement. The earlier you start saving for all your goals, the better.
Interested in opening an online bank account? When you sign up for a SoFi Checking and Savings account with eligible direct deposit, you’ll get a competitive annual percentage yield (APY), pay zero account fees, and enjoy an array of rewards, such as access to the Allpoint Network of 55,000+ fee-free ATMs globally. Qualifying accounts can even access their paycheck up to two days early.
FAQ
How much should a 30 year old have in savings?
By age 30, you should have the equivalent of your annual salary saved. So if you make $60,000 a year, you should have $60,000 in savings.
How much money does an average person have in savings?
The average American has a savings balance of $62,410, according to the 2022 Federal Reserve Survey of Consumer Finances, which is the latest data available.
How many Americans have $100,000 in savings?
According to one 2023 survey, only 14% of Americans have at least $100,000 in savings.
SoFi Checking and Savings is offered through SoFi Bank, N.A. Member FDIC. The SoFi® Bank Debit Mastercard® is issued by SoFi Bank, N.A., pursuant to license by Mastercard International Incorporated and can be used everywhere Mastercard is accepted. Mastercard is a registered trademark, and the circles design is a trademark of Mastercard International Incorporated.
Annual percentage yield (APY) is variable and subject to change at any time. Rates are current as of 12/23/25. There is no minimum balance requirement. Fees may reduce earnings. Additional rates and information can be found at https://www.sofi.com/legal/banking-rate-sheet
Eligible Direct Deposit means a recurring deposit of regular income to an account holder’s SoFi Checking or Savings account, including payroll, pension, or government benefit payments (e.g., Social Security), made by the account holder’s employer, payroll or benefits provider or government agency (“Eligible Direct Deposit”) via the Automated Clearing House (“ACH”) Network every 31 calendar days.
Although we do our best to recognize all Eligible Direct Deposits, a small number of employers, payroll providers, benefits providers, or government agencies do not designate payments as direct deposit. To ensure you're earning the APY for account holders with Eligible Direct Deposit, we encourage you to check your APY Details page the day after your Eligible Direct Deposit posts to your SoFi account. If your APY is not showing as the APY for account holders with Eligible Direct Deposit, contact us at 855-456-7634 with the details of your Eligible Direct Deposit. As long as SoFi Bank can validate those details, you will start earning the APY for account holders with Eligible Direct Deposit from the date you contact SoFi for the next 31 calendar days. You will also be eligible for the APY for account holders with Eligible Direct Deposit on future Eligible Direct Deposits, as long as SoFi Bank can validate them.
Deposits that are not from an employer, payroll, or benefits provider or government agency, including but not limited to check deposits, peer-to-peer transfers (e.g., transfers from PayPal, Venmo, Wise, etc.), merchant transactions (e.g., transactions from PayPal, Stripe, Square, etc.), and bank ACH funds transfers and wire transfers from external accounts, or are non-recurring in nature (e.g., IRS tax refunds), do not constitute Eligible Direct Deposit activity. There is no minimum Eligible Direct Deposit amount required to qualify for the stated interest rate. SoFi Bank shall, in its sole discretion, assess each account holder's Eligible Direct Deposit activity to determine the applicability of rates and may request additional documentation for verification of eligibility.
See additional details at https://www.sofi.com/legal/banking-rate-sheet.
We do not charge any account, service or maintenance fees for SoFi Checking and Savings. We do charge a transaction fee to process each outgoing wire transfer. SoFi does not charge a fee for incoming wire transfers, however the sending bank may charge a fee. Our fee policy is subject to change at any time. See the SoFi Bank Fee Sheet for details at sofi.com/legal/banking-fees/.
*Awards or rankings from NerdWallet are not indicative of future success or results. This award and its ratings are independently determined and awarded by their respective publications.
Financial Tips & Strategies: The tips provided on this website are of a general nature and do not take into account your specific objectives, financial situation, and needs. You should always consider their appropriateness given your own circumstances.
Third-Party Brand Mentions: No brands, products, or companies mentioned are affiliated with SoFi, nor do they endorse or sponsor this article. Third-party trademarks referenced herein are property of their respective owners.
Disclaimer: The projections or other information regarding the likelihood of various investment outcomes are hypothetical in nature, do not reflect actual investment results, and are not guarantees of future results.
Investment Risk: Diversification can help reduce some investment risk. It cannot guarantee profit, or fully protect in a down market.
Third Party Trademarks: Certified Financial Planner Board of Standards Center for Financial Planning, Inc. owns and licenses the certification marks CFP®, CERTIFIED FINANCIAL PLANNER®
External Websites: The information and analysis provided through hyperlinks to third-party websites, while believed to be accurate, cannot be guaranteed by SoFi. Links are provided for informational purposes and should not be viewed as an endorsement.
SOBNK-Q325-095
CN-Q425-3236452-35
Q126-3525874-012