Buying Stocks Without a Broker

Buying stocks without a broker can be done, typically through the use of a self-administered brokerage service, or one of a couple of different types of investing plans. Buying stocks may help you get started on the path to building wealth. And just like hiring professional movers can help make relocating less stressful, purchasing stocks through a broker can make the process of diversifying your portfolio easier.

That, however, can involve paying commissions and fees to trade stocks and other securities. Potential investors who are trying to curb investment costs might wonder how to buy stocks online without a broker being involved.

Key Points

•   Buying stocks without a broker is possible through online brokerage accounts, dividend reinvestment plans, and direct stock purchase plans.

•   Full-service brokers may offer additional services like trading advice and personalized investment strategies.

•   Direct stock purchase plans allow investors to buy shares directly from the company, while dividend reinvestment plans reinvest dividends to purchase more stock.

•   Online brokerage accounts often offer convenience, lower fees, and the ability to customize investment strategies.

•   Each option has its pros and cons, and investors should consider their preferences and goals before choosing a method.

How Can I Buy Stocks Without a Broker?

It is possible to buy stocks without a broker. In fact, there are three alternatives to using a full-service broker: opening an online brokerage account, investing in a dividend reinvestment plan, and investing in a direct stock purchase plan. So, the short answer is yes, you can buy stocks without a broker.

But it may be useful to understand why some investors do choose to use a broker when making stock purchases.

Get up to $1,000 in stock when you fund a new Active Invest account.*

Access stock trading, options, alternative investments, IRAs, and more. Get started in just a few minutes.


*Customer must fund their Active Invest account with at least $50 within 45 days of opening the account. Probability of customer receiving $1,000 is 0.026%. See full terms and conditions.

Benefits of Using a Broker to Buy Stocks

As their name implies, stockbrokers can help broker trades of stocks and other securities on behalf of their clients. In return, they may earn commissions for making those trades. But that’s just one thing a full-service broker can do. A stockbroker’s role may also involve:

•   Offering trading advice to clients based on their experience with the stock exchange and education.

•   Giving their clients additional tips and suggestions, like what investments they should buy and sell or when it makes sense to do so.

•   Building relationships with their clients to better understand and inform individual investment strategies.

A stockbroker’s salary is largely dependent on commissions, which means they’ve got to be pretty good at what they do to make a living. Investors can benefit from the education, training, and experience a stockbroker accumulates over the course of their career.

That being said, for most stockbrokers, their payment comes from your trades, which means a client has to pay their stockbroker every time they buy, sell, and trade. For some, the knowledge of a stockbroker is worth the cost of doing business. For others, the idea of DIY investing is more appealing. It all depends on personal preference.

💡 Quick Tip: When you’re actively investing in stocks, it’s important to ask what types of fees you might have to pay. For example, brokers may charge a flat fee for trading stocks, or require some commission for every trade. Taking the time to manage investment costs can be beneficial over the long term.

How to Buy Stocks Online Without a Broker

DIY investors have several options for buying stocks without brokers online. Here’s a closer look at how each one works.

Direct Stock Purchase Plans

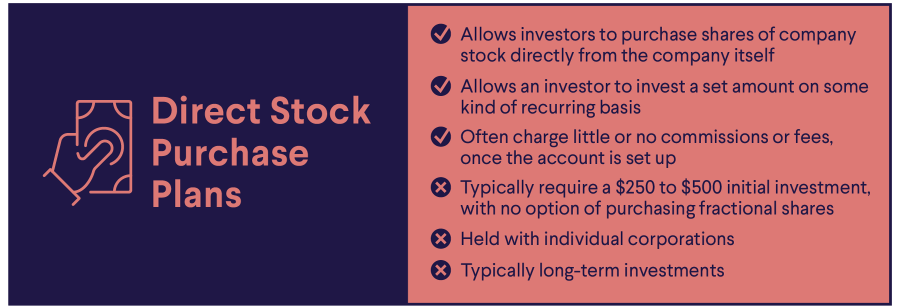
Direct Stock Purchase Plans (DSPPs) allow investors to purchase shares of company stock directly from the company itself. Specifically, trades are completed through a transfer agent.That means you could buy stocks without a broker, full-service or online, to complete the transaction.

DSPPs can be offered by companies that are publicly traded on a stock exchange, though not all publicly traded companies offer DSPPs. Each company can determine what minimum investment to require for initial and subsequent stock purchases.

Direct Stock Purchase Plans

Pros of Buying DSPPs

Buying DSPPs comes with its own unique set of advantages:

•   Passive investing: Many DSPPs plans allow an investor to invest a set amount on some kind of recurring basis — sort of a “set it and forget it” strategy.

•   Lower fees: DSPPs often charge little or no commissions or fees, once the account is set up.

•   An investor might get a discount: Depending on the company a person invests in, they might be offered a slight discount, between 1% and 10%, for investing directly.

Cons of Buying DSPPs

While DSPPs have benefits, there are some drawbacks as well:

•   Higher upfront costs: There is typically a cost associated with starting a DSPP account, and DSPPs typically require a $250 to $500 initial investment, with no option of purchasing fractional shares.

•   It’s another account: DSPPs are held with individual corporations. So if an investor has DSPP holdings with multiple companies, each will live on the company’s individual platform.

•   They’re typically long-term investments: DSPPs don’t offer the same flexibility and speed of an online broker. For that reason, they’re typically considered more appropriate for a long term investment.

Dividend Reinvestment Plans

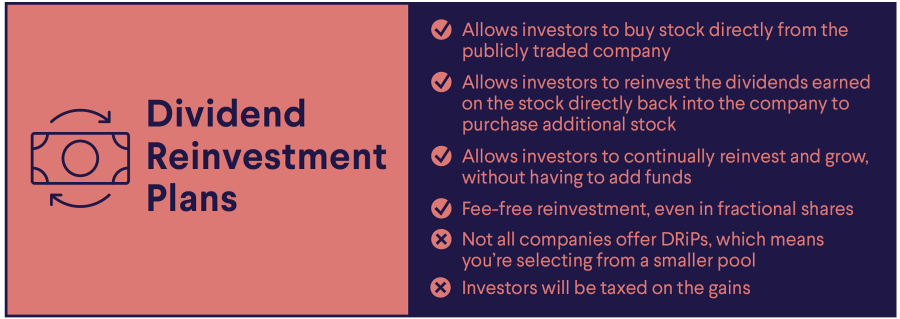
Dividend Reinvestment Plans (DRiPs), share many similarities to DSPPs — in fact, some DSPPs offer DRiP programs. With a DRiP, investors can still buy stock directly from the publicly traded company, but they can also reinvest the dividends earned on the stock directly back into the company to purchase additional stock.

Dividend Reinvestment Plans

Pros of DRiP Programs

In addition to the benefits of DSPPs, DRiPs have a few to offer on their own if you’d like buy stock without a broker:

•   Automated, compounded growth: Reinvesting dividends is not dissimilar to compound interest. DRiPs allow investors to continually reinvest and grow, without having to add funds.

•   Fee-free reinvestment, even in fractional shares: Investing the dividends comes fee-free. Investors are also usually offered the opportunity to buy fractions of a share.

Cons of DRiP Programs

DRiPs share many of the same drawbacks as DSPPs, but also have a few specific to them:

•   Limited selection: Not all companies that offer DSPPs offer DRiPs, which means you’re selecting from a smaller pool.

•   Dividends are still taxable: Although the cash is automatically reinvested in a DRiP, investors will still be taxed on the gains. That means they may want to have liquidity elsewhere to pay the tax.

Online Brokerage Account

Online brokerage accounts offer the convenience of being able to buy stocks online without a traditional full-service broker (and the typical traditional broker fees). Think of it as the difference between dining at a full-service restaurant versus a self-serve buffet.

After opening an account with an online brokerage,an investor can tell their broker what they want to buy, and how much of it. Then the broker completes the order.

Depending on the online broker, there may be low or no fees associated with making a trade.

Online Brokerage Accounts

Pros of Investing with an Online Broker

It might sound pretty easy, but online investing has both pros and cons. Here are a few of the advantages:

•   Low fees: When it comes to online investing, people can typically expect to pay lower fees. Many online firms do not charge commissions.

•   DIY investing: There’s a lot of freedom that can come with an online brokerage account. An investor gets to choose, creating a customized plan.

•   On-demand investing: As long as the markets are open, an investor can ask for trades through their digital brokerage account.

Cons of Investing with an Online Broker

Depending on an investor’s personality and preferences, there may be a few drawbacks to using an online broker:

•   It’s all on the investor. Online investing can give investors a lot of choice and freedom, but without the expertise of qualified financial professionals, some investors might be left to research and form a strategy on their own. For some, this might feel stressful.

•   It’s for the long term. Since online investing is on-demand, a person can sell whenever they like. That can be a challenge for an investor if patience isn’t their strong suit.


Test your understanding of what you just read.


The Takeaway

It’s possible to buy stocks without a full-time broker. For instance, investors can use an online brokerage account to trade stocks on their own, or invest using different types of investment plans. But there can be pros and cons to each.

While there are some advantages to using a traditional full-service broker to purchase stocks, you don’t necessarily need one in order to invest. However, if you don’t feel comfortable doing it yourself, you can speak with a financial professional for guidance.

Invest in what matters most to you with SoFi Active Invest. In a self-directed account provided by SoFi Securities, you can trade stocks, exchange-traded funds (ETFs), mutual funds, alternative funds, options, and more — all while paying $0 commission on every trade. Other fees may apply. Whether you want to trade after-hours or manage your portfolio using real-time stock insights and analyst ratings, you can invest your way in SoFi's easy-to-use mobile app.

Opening and funding an Active Invest account gives you the opportunity to get up to $1,000 in the stock of your choice.¹


About the author

Rebecca Lake

Rebecca Lake

Rebecca Lake has been a finance writer for nearly a decade, specializing in personal finance, investing, and small business. She is a contributor at Forbes Advisor, SmartAsset, Investopedia, The Balance, MyBankTracker, MoneyRates and CreditCards.com. Read full bio.


INVESTMENTS ARE NOT FDIC INSURED • ARE NOT BANK GUARANTEED • MAY LOSE VALUE

SoFi Invest is a trade name used by SoFi Wealth LLC and SoFi Securities LLC offering investment products and services. Robo investing and advisory services are provided by SoFi Wealth LLC, an SEC-registered investment adviser. Brokerage and self-directed investing products offered through SoFi Securities LLC, Member FINRA/SIPC.

For disclosures on SoFi Invest platforms visit SoFi.com/legal. For a full listing of the fees associated with Sofi Invest please view our fee schedule.

Financial Tips & Strategies: The tips provided on this website are of a general nature and do not take into account your specific objectives, financial situation, and needs. You should always consider their appropriateness given your own circumstances.


¹Probability of Member receiving $1,000 is a probability of 0.026%; If you don’t make a selection in 45 days, you’ll no longer qualify for the promo. Customer must fund their account with a minimum of $50.00 to qualify. Probability percentage is subject to decrease. See full terms and conditions.

SOIN0523122

Read more

How to Calculate Expected Rate of Return

When investing, you often want to know how much money an investment is likely to earn you. That’s where the expected rate of return comes in; expected rate of return is calculated using the probabilities of investment returns for various potential outcomes. Investors can utilize the expected return formula to help project future returns.

Though it’s impossible to predict the future, having some idea of what to expect can be critical in setting expectations for a good return on investment.

Key Points

•   The expected rate of return is the profit or loss an investor expects from an investment based on historical rates of return and the probability of different outcomes.

•   The formula for calculating the expected rate of return involves multiplying the potential returns by their probabilities and summing them.

•   Historical data can be used to estimate the probability of different returns, but past performance is not a guarantee of future results.

•   The expected rate of return does not consider the risk involved in an investment and should be used in conjunction with other factors when making investment decisions.

What Is the Expected Rate of Return?

The expected rate of return — also known as expected return — is the profit or loss an investor expects from an investment, given historical rates of return and the probability of certain returns under different scenarios. The expected return formula projects potential future returns.

Expected return is a speculative financial metric investors can use to determine where to invest their money. By calculating the expected rate of return on an investment, investors get an idea of how that investment may perform in the future.

This financial concept can be useful when there is a robust pool of historical data on the returns of a particular investment. Investors can use the historical data to determine the probability that an investment will perform similarly in the future.

However, it’s important to remember that past performance is far from a guarantee of future performance. Investors should be careful not to rely on expected returns alone when making investment decisions.

💡 Quick Tip: When you’re actively investing in stocks, it’s important to ask what types of fees you might have to pay. For example, brokers may charge a flat fee for trading stocks, or require some commission for every trade. Taking the time to manage investment costs can be beneficial over the long term.

How To Calculate Expected Return

To calculate the expected rate of return on a stock or other security, you need to think about the different scenarios in which the asset could see a gain or loss. For each scenario, multiply that amount of gain or loss (return) by its probability. Finally, add up the numbers you get from each scenario.

The formula for expected rate of return looks like this:

Expected Return = (R1 * P1) + (R2 * P2) + … + (Rn * Pn)

In this formula, R is the rate of return in a given scenario, P is the probability of that return, and n is the number of scenarios an investor may consider.

For example, say there is a 40% chance an investment will see a 20% return, a 50% chance that the investment will return 10%, and a 10% chance the investment will decline 10%. (Note: all the probabilities must add up to 100%)

The expected return on this investment would be calculated using the formula above:

Expected Return = (40% x 20%) + (50% x 10%) + (10% x -10%)

Expected Return = 8% + 5% – 1%

Expected Return = 12%

What Is Rate of Return?

The expected rate of return mentioned above looks at an investment’s potential profit and loss. In contrast, the rate of return looks at the past performance of an asset.

A rate of return is the percentage change in value of an investment from its initial cost. When calculating the rate of return, you look at the net gain or loss in an investment over a particular time period. The simple rate of return is also known as the return on investment (ROI).

Recommended: What Is the Average Stock Market Return?

How to Calculate Rate of Return

The formula to calculate the rate of return is:

Rate of return = [(Current value − Initial value) ÷ Initial Value ] × 100

Let’s say you own a share that started at $100 in value and rose to $110 in value. Now, you want to find its rate of return.

In our example, the calculation would be [($110 – $100) ÷ $100] x 100 = 10

A rate of return is typically expressed as a percentage of the investment’s initial cost. So, if you were to sell your share, this investment would have a 10% rate of return.

Recommended: What Is Considered a Good Return on Investment?

Get up to $1,000 in stock when you fund a new Active Invest account.*

Access stock trading, options, alternative investments, IRAs, and more. Get started in just a few minutes.


*Customer must fund their Active Invest account with at least $50 within 45 days of opening the account. Probability of customer receiving $1,000 is 0.026%. See full terms and conditions.

Different Ways to Calculate Expected Rate of Return

How to Calculate Expected Return Using Historical Data

To calculate the expected return of a single investment using historical data, you’ll want to take an average rate of returns in certain years to determine the probability of those returns. Here’s an example of what that would look like:

Annual Returns of a Share of Company XYZ

Year

Return

2011 16%
2012 22%
2013 1%
2014 -4%
2015 8%
2016 -11%
2017 31%
2018 7%
2019 13%
2020 22%

For Company XYZ, the stock generated a 21% average rate of return in five of the ten years (2011, 2012, 2017, 2019, and 2020), a 5% average return in three of the years (2013, 2015, 2018), and a -8% average return in two of the years (2014 and 2016).

Using this data, you may assume there is a 50% probability that the stock will have a 21% rate of return, a 30% probability of a 5% return, and a 20% probability of a -8% return.

The expected return on a share of Company XYZ would then be calculated as follows:

Expected return = (50% x 21%) + (30% x 5%) + (20% x -8%)

Expected return = 10% + 2% – 2%

Expected return = 10%

Based on the historical data, the expected rate of return for this investment would be 10%.

However, when using historical data to determine expected returns, you may want to consider if you are using all of the data available or only data from a select period. The sample size of the historical data could skew the results of the expected rate of return on the investment.

How to Calculate Expected Return Based on Probable Returns

When using probable rates of return, you’ll need the data point of the expected probability of an outcome in a given scenario. This probability can be calculated, or you can make assumptions for the probability of a return. Remember, the probability column must add up to 100%. Here’s an example of how this would look.

Expected Rate of Return for a Stock of Company ABC

Scenario

Return

Probability

Outcome (Return * Probability)

1 14% 30% 4.2%
2 2% 10% 0.2%
3 22% 30% 6.6%
4 -18% 10% -1.8%
5 -21% 10% -2.1%
Total 100% 7.1%

Using the expected return formula above, in this hypothetical example, the expected rate of return is 7.1%.

Calculate Expected Rate of Return on a Stock in Excel

Follow these steps to calculate a stock’s expected rate of return in Excel (or another spreadsheet software):

1. In the first row, enter column labels:

•   A1: Investment

•   B1: Gain A

•   C1: Probability of Gain A

•   D1: Gain B

•   E1: Probability of Gain B

•   F1: Expected Rate of Return

2. In the second row, enter your investment name in B2, followed by its potential gains and the probability of each gain in columns C2 – E2

•   Note that the probabilities in C2 and E2 must add up to 100%

3. In F2, enter the formula = (B2*C2)+(D2*E2)

4. Press enter, and your expected rate of return should now be in F2

If you’re working with more than two probabilities, extend your columns to include Gain C, Probability of Gain C, Gain D, Probability of Gain D, etc.

If there’s a possibility for loss, that would be negative gain, represented as a negative number in cells B2 or D2.

Limitations of the Expected Rate of Return Formula

Historical data can be a good place to start in understanding how an investment behaves. That said, investors may want to be leery of extrapolating past returns for the future. Historical data is a guide; it’s not necessarily predictive.

Another limitation to the expected returns formula is that it does not consider the risk involved by investing in a particular stock or other asset class. The risk involved in an investment is not represented by its expected rate of return.

In this historical return example above, 10% is the expected rate of return. What that number doesn’t reveal is the risk taken in order to achieve that rate of return. The investment experienced negative returns in the years 2014 and 2016. The variability of returns is often called volatility.

Standard Deviation

To understand the volatility of an investment, you may consider looking at its standard deviation. Standard deviation measures volatility by calculating a dataset’s dispersion (values’ range) relative to its mean. The larger the standard deviation, the larger the range of returns.

Consider two different investments: Investment A has an average annual return of 10%, and Investment B has an average annual return of 6%. But when you look at the year-by-year performance, you’ll notice that Investment A experienced significantly more volatility. There are years when returns are much higher and lower than with Investment B.

Year

Annual Return of Investment A

Annual Return of Investment B

2011 16% 8%
2012 22% 4%
2013 1% 3%
2014 -6% 0%
2015 8% 6%
2016 -11% -2%
2017 31% 9%
2018 7% 5%
2019 13% 15%
2020 22% 14%
Average Annual Return 10% 6%
Standard Deviation 13% 5%

Investment A has a standard deviation of 13%, while Investment B has a standard deviation of 5%. Although Investment A has a higher rate of return, there is more risk. Investment B has a lower rate of return, but there is less risk. Investment B is not nearly as volatile as Investment A.

Recommended: A Guide to Historical Volatility

Systematic and Unsystematic Risk

All investments are subject to pressures in the market. These pressures, or sources of risk, can come from systematic and unsystematic risks. Systematic risk affects an entire investment type. Investors may struggle to reduce the risk through diversification within that asset class.

Because of systematic risk, you may consider building an investment strategy that includes different asset types. For example, a sweeping stock market crash could affect all or most stocks and is, therefore, a systematic risk. However, if your portfolio includes different types of bonds, commodities, and real estate, you may limit the impact of the equities crash.

In the stock market, unsystematic risk is specific to one company, country, or industry. For example, technology companies will face different risks than healthcare and energy companies. This type of risk can be mitigated with portfolio diversification, the process of purchasing different types of investments.

Expected Rate of Return vs Required Rate of Return

Expected return is just one financial metric that investors can use to make investment decisions. Similarly, investors may use the required rate of return (RRR) to determine the amount of money an investment needs to generate to be worth it for the investor. The required rate of return incorporates the risk of an investment.

What Is the Dividend Discount Model?

Investors may use the dividend discount model to determine an investment’s required rate of return. The dividend discount model can be used for stocks with high dividends and steady growth. Investors use a stock’s price, dividend payment per share, and projected dividend growth rate to calculate the required rate of return.

The formula for the required rate of return using the dividend discount model is:

RRR = (Expected dividend payment / Share price) + Projected dividend growth rate

So, if you have a stock paying $2 in dividends per year and is worth $20 and the dividends are growing at 5% a year, you have a required rate of return of:

RRR = ($2 / $20) + 0.5

RRR = .10 + .05

RRR = .15, or 15%

What is the Capital Asset Pricing Model?

The other way of calculating the required rate of return is using a more complex model known as the capital asset pricing model.

In this model, the required rate of return is equal to the risk-free rate of return, plus what’s known as beta (the stock’s volatility compared to the market), which is then multiplied by the market rate of return minus the risk-free rate. For the risk-free rate, investors usually use the yield of a short-term U.S. Treasury.

The formula is:

RRR = Risk-free rate of return + Beta x (Market rate of return – Risk-free rate of return)

For example, let’s say an investment has a beta of 1.5, the market rate of return is 5%, and a risk-free rate of 1%. Using the formula, the required rate of return would be:

RRR = .01 + 1.5 x (.05 – .01)

RRR = .01 + 1.5 x (.04)

RRR = .01 + .06

RRR = .07, or 7%


Test your understanding of what you just read.


The Takeaway

There’s no way to predict the future performance of an investment or portfolio. However, by looking at historical data and using the expected rate of return formula, investors can get a better sense of an investment’s potential profit or loss.

There’s no guarantee that the actual performance of a stock, fund, or other assets will match the expected return. Nor does expected return consider the risk and volatility of assets. It’s just one factor an investor should consider when deciding on investments and building a portfolio.

Invest in what matters most to you with SoFi Active Invest. In a self-directed account provided by SoFi Securities, you can trade stocks, exchange-traded funds (ETFs), mutual funds, alternative funds, options, and more — all while paying $0 commission on every trade. Other fees may apply. Whether you want to trade after-hours or manage your portfolio using real-time stock insights and analyst ratings, you can invest your way in SoFi's easy-to-use mobile app.

Opening and funding an Active Invest account gives you the opportunity to get up to $1,000 in the stock of your choice.¹

FAQ

How do you find the expected rate of return?

An investment’s expected rate of return is the average rate of return that an investor can expect to receive over the life of the investment. Investors can calculate the expected return by multiplying the potential return of an investment by the chances of it occurring and then totaling the results.

How do you calculate the expected rate of return on a portfolio?

The expected rate of return on a portfolio is the weighted average of the expected rates of return on the individual assets in the portfolio. You first need to calculate the expected return for each investment in a portfolio, then weigh those returns by how much each investment makes up in the portfolio.

What is a good rate of return?

A good rate of return varies from person to person. Some investors may be satisfied with a lower rate of return if its performance is consistent, while others may be more aggressive and aim for a higher rate of return even if it is more volatile. Ultimately, it is up to the individual to decide what is considered a good rate of return.


INVESTMENTS ARE NOT FDIC INSURED • ARE NOT BANK GUARANTEED • MAY LOSE VALUE

SoFi Invest is a trade name used by SoFi Wealth LLC and SoFi Securities LLC offering investment products and services. Robo investing and advisory services are provided by SoFi Wealth LLC, an SEC-registered investment adviser. Brokerage and self-directed investing products offered through SoFi Securities LLC, Member FINRA/SIPC.

For disclosures on SoFi Invest platforms visit SoFi.com/legal. For a full listing of the fees associated with Sofi Invest please view our fee schedule.

Financial Tips & Strategies: The tips provided on this website are of a general nature and do not take into account your specific objectives, financial situation, and needs. You should always consider their appropriateness given your own circumstances.


¹Probability of Member receiving $1,000 is a probability of 0.026%; If you don’t make a selection in 45 days, you’ll no longer qualify for the promo. Customer must fund their account with a minimum of $50.00 to qualify. Probability percentage is subject to decrease. See full terms and conditions.

SOIN-Q224-1912117-V1

Read more
percent sign yellow background

How to Calculate Portfolio Beta

Portfolio beta refers to a popular metric that investors use to measure a portfolio’s risk, or its sensitivity to price swings in the broader market. While past performance does not indicate future returns, knowing a portfolio’s beta can help investors understand the price variability of their stocks, or how much their holdings may move if there’s stock volatility or big gains in a benchmark index like the S&P 500.

Investors often consider beta a measure of systematic risk, or risk that stems from the entire market and that investors can not diversify away. Macro events such as interest-rate or economic changes often fall into the category of systematic risk, while idiosyncratic, stock-specific risk includes events like a change in company management, new competitors, changed regulation, or product recalls.

Key Points

•   Portfolio beta is a metric used to measure the sensitivity of a portfolio’s returns to market movements, indicating its systematic risk.

•   To calculate the beta of a portfolio, the beta of each stock is multiplied by its proportional value in the portfolio, and these products are then summed.

•   Stocks with a beta greater than one are more volatile than the market, while those with a beta less than one are less volatile.

•   Negative beta values indicate an inverse relationship to the market, which can be characteristic of assets like gold or defensive stocks.

•   Understanding a portfolio’s beta is crucial for investors aiming to manage risk in alignment with their investment strategy and market outlook.

How to Calculate Beta of a Portfolio

The Beta of a portfolio formula requires relatively simple math, as long as investors know the Beta for each stock that they hold and the portion of your portfolio that each stock comprises.

Here are the steps you’d follow to calculate the Beta of a hypothetical portfolio:

1.    Calculate the total value of each stock in the portfolio by multiplying the number of shares that you own of the stock by the price of its shares:

Stock ABB: 500 shares X $20 a share each = $10,000.

2.    Figure out what proportion each stock in their portfolio represents by dividing the stock’s total value by the portfolio’s total value:

Stock ABB’s total value of $10,000/Portfolio’s total value of $80,000 = 0.125.

3.    Multiply each stock’s fractional share by its Beta. This will calculate the stock’s weighted beta:

Stock ABB’s beta of 1.2 X its fractional portfolio of 0.125 = 0.15.

4.    Add up the individual weighted betas.

Here is the whole hypothetical portfolio with a total beta of 1.22, benchmarked to the S&P 500. That means when the index moves 1%, this portfolio as a whole is 22% more risky than the index.

Stock

Value

Portfolio Share

Stock Beta Weighted Beta
ABB $10,000 0.125 1.20 0.15
CDD $30,000 0.375 0.85 0.319
EFF $15,000 0.1875 1.65 0.309
GHH $25,000 0.3125 1.42 0.44375
Sum 1.22

Get up to $1,000 in stock when you fund a new Active Invest account.*

Access stock trading, options, alternative investments, IRAs, and more. Get started in just a few minutes.


*Customer must fund their Active Invest account with at least $50 within 45 days of opening the account. Probability of customer receiving $1,000 is 0.026%. See full terms and conditions.

4 Ways to Characterize Beta

Investors always measure a portfolio’s beta against a benchmark index, which they give a value of 1. Stocks that have a beta higher than one are more volatile than the overall market, and those with a beta of less than one are less volatile than the overall market.

Understanding beta is part of fundamental stock analysis. Once you know the beta of your portfolio, you can make changes in order to increase or decrease its risk based on your overall investment strategy by changing your asset allocation.

There are four ways to characterize beta:

High Beta

A high beta stock — one that tends to rise and fall along with the market often — has a value of greater than 1. So if a stock has a beta of 1.2 and is benchmarked to the S&P 500, it is 20% more volatile than the broader measure.

If the S&P 500 rises or falls 10%, then the stock would conversely rise or fall 12%. The same would be true for portfolio beta. While there’s more downside risk with high-beta stocks, they can also generate bigger returns when the market rallies – a principle of Modern Portfolio Theory.

Low Beta

A low beta stock with a beta of 0.5 would be half as volatile as the market. So if the S&P 500 moved 1%, the stock would post a 0.5% swing. Such a stock may have less volatility, but it also may have less potential to post large gains as well.

Still, investors often prefer lower volatility securities. Low beta investment strategies have shown strong risk-adjusted returns over time, too.

Negative Beta

Stocks or portfolios with a negative beta value inversely correlate with the rest of the market. So when the S&P 500 rises, shares of these companies would go down or vice versa.

Gold, for instance, often moves in the opposite direction as stocks, since investors tend to turn to the metal as a haven during stock volatility. Therefore, a portfolio of gold-mining companies could have a negative beta.

So-called defensive stocks like utility companies also sometimes have negative beta, as investors buy their shares when seeking assets less tied to the health of the economy. A downside to negative beta is that expected returns on negative beta securities tend to be weak – even less than the risk-free interest rate.

Zero Beta

A stock or portfolio can also have a beta of zero, which means it’s uncorrelated with the market. Some hedge funds seek a market-neutral strategy. Being market-neutral means attempting to perform completely indifferent to how an index like the S&P 500 behaves.

💡 Quick Tip: Options can be a cost-efficient way to place certain trades, because you typically purchase options contracts, not the underlying security. That said, options trading can be risky, and best done by those who are not entirely new to investing.

How to Calculate an Individual Stock’s Beta

For investors, calculating the beta of all their stock holdings can be time consuming, and typically, financial data or brokerage firms offer beta values for stocks.

But if you wanted to calculate beta for an individual stock, you’d divide a measure of a stock’s returns relative to the broader market over a given time frame by a measure of the market’s return by its mean, also over a specific time frame. Here is the formula:

Beta = covariance/variance

Covariance is a measure of a security’s returns relative to the market’s returns.

Variance is a measure of the market’s return relative to its mean or average.

Alpha vs Beta vs Smart Beta

Beta is one of the Option Greeks, terminology frequently used by traders to refer to characteristics of specific securities or derivatives in the market. Another commonly used Greek term is Alpha. While beta refers to an asset’s volatility relative to the broader market, Alpha is a measure of outperformance relative to the rest of the market.

Beta also comes up a lot in the exchange-traded fund or ETF industry. Smart Beta ETFs are funds that incorporate rules- or factor-based strategies.

What Impacts Beta?

A variety of factors impact an asset’s beta. In general, stocks seen as riskier than average typically feature higher betas. Stock-specific factors such as debt levels, aggressive management, bold projects, volatile cash flows, and even ESG factors can influence a stock’s idiosyncratic risk. Higher business risk, while stock-specific, can lead to a more volatile stock price than the overall market, hence a higher beta.

Higher betas often appear in particular sectors. There are even investment fund strategies that play on beta – you can buy funds that exclusively own high beta or low beta stocks. A stock’s sector, industry, geographic location, and market cap size all impact a stock’s volatility and beta.

Cyclical and growth sectors like energy, industrials, information technology, and consumer discretionary often feature high betas. Utilities, consumer staples, real estate, and much of the healthcare sector typically have low beta.

Small caps and stocks domiciled in emerging-market economies also often have a higher beta (compared to the U.S. large-cap S&P 500).

💡 Quick Tip: Are self-directed brokerage accounts cost efficient? They can be, because they offer the convenience of being able to buy stocks online without using a traditional full-service broker (and the typical broker fees).

Important Things to Know About Beta

1.    A stock’s beta may change over time. Because beta relies on historical price data, it is subject to change.

2.    Beta is not a complete measure of risk. It can be a useful way for investors to estimate short-term risk but it’s less helpful when it comes to considering a long-term investment because the macroeconomic environment and company’s fundamentals may change. In some cases, beta is not the best measure of a stock or a portfolio’s risk.

3.    Beta is an input when investors are using the Capital Asset Pricing Model (CAPM) — a way to measure the expected return of assets taking into account systematic risk. It’s a method that also looks at the cost of capital for investors.

4.    The estimated beta of a stock will be less helpful for companies that do not trade as frequently. Thin liquidity for a stock may bias its beta value since there is less robust historical price data.

5.    Beta does not offer a complete picture of a stock’s risk profile as it’s linked to systematic risk. Investors must also consider stock-specific risk when managing their portfolios.


Test your understanding of what you just read.


The Takeaway

As discussed, beta is a popular metric that investors use to measure a portfolio’s risk, or its sensitivity to price swings in the broader market. Knowing stock holdings’ betas can be important information when you’re building your portfolios.

You can calculate their portfolio beta using simple math as long as you’re able to obtain the individual betas for your stock holdings. While beta is a helpful tool to try to gauge potential volatility in a portfolio, its reliance on historical data makes it limited in measuring the complete risk profile of an asset or portfolio.

SoFi’s options trading platform offers qualified investors the flexibility to pursue income generation, manage risk, and use advanced trading strategies. Investors may buy put and call options or sell covered calls and cash-secured puts to speculate on the price movements of stocks, all through a simple, intuitive interface.

With SoFi Invest® online options trading, there are no contract fees and no commissions. Plus, SoFi offers educational support — including in-app coaching resources, real-time pricing, and other tools to help you make informed decisions, based on your tolerance for risk.

Opening and funding an Active Invest account gives you the opportunity to get up to $1,000 in the stock of your choice.¹

FAQ

What is a good beta for a portfolio?

In a general sense, a good beta for a portfolio would be 1. That’s only a general guideline or rule of thumb, however, as it means that a portfolio’s value is roughly as volatile as the market overall.

What does a beta of 1.3 mean?

A beta of 1.3 means that a portfolio’s value is 30% more volatile than the overall market, which means its value will swing more wildly than the market.

Why is market portfolio beta 1?

Beta measures a portfolio or asset’s sensitivity relative to the overall market. If a portfolio’s beta is 1, it is equally as volatile as the market, not more or less so.

How do I reduce my portfolio beta?

Perhaps the simplest way to reduce your overall portfolio’s beta is to replace higher-beta assets within the portfolio with assets that have lower associated beta.

Is it possible to have zero beta portfolio?

It is possible, and would amount to a zero-beta portfolio, which means the portfolio itself has no systemic risk whatsoever. In other words, this portfolio would have no relationship to the overall movements of the market, and likely have low returns.

What is the difference between stock beta and portfolio beta?

A stock beta is a measure of an individual stock’s volatility, while portfolio beta is a measure of an overall investment portfolio’s volatility.


INVESTMENTS ARE NOT FDIC INSURED • ARE NOT BANK GUARANTEED • MAY LOSE VALUE

SoFi Invest is a trade name used by SoFi Wealth LLC and SoFi Securities LLC offering investment products and services. Robo investing and advisory services are provided by SoFi Wealth LLC, an SEC-registered investment adviser. Brokerage and self-directed investing products offered through SoFi Securities LLC, Member FINRA/SIPC.

For disclosures on SoFi Invest platforms visit SoFi.com/legal. For a full listing of the fees associated with Sofi Invest please view our fee schedule.

Financial Tips & Strategies: The tips provided on this website are of a general nature and do not take into account your specific objectives, financial situation, and needs. You should always consider their appropriateness given your own circumstances.

Options involve risks, including substantial risk of loss and the possibility an investor may lose the entire amount invested in a short period of time. Before an investor begins trading options they should familiarize themselves with the Characteristics and Risks of Standardized Options . Tax considerations with options transactions are unique, investors should consult with their tax advisor to understand the impact to their taxes.

[cd_ETFs]

¹Probability of Member receiving $1,000 is a probability of 0.026%; If you don’t make a selection in 45 days, you’ll no longer qualify for the promo. Customer must fund their account with a minimum of $50.00 to qualify. Probability percentage is subject to decrease. See full terms and conditions.

SOIN0124081

Read more
What Is Max Pain in Options Trading?

What Is Max Pain in Options Trading?


Editor's Note: Options are not suitable for all investors. Options involve risks, including substantial risk of loss and the possibility an investor may lose the entire amount invested in a short period of time. Please see the Characteristics and Risks of Standardized Options.

In options trading, the term “max pain” is short for “maximum pain price,” and refers to the strike price where the most open interest exists — open interest being the total number of active options contracts that haven’t been settled or closed.This max pain figure combines both puts and calls, representing the price at which option buyers face the highest potential losses at expiration.

Although max pain theory’s price movement predictions aren’t guaranteed, understanding how it works can help traders understand market dynamics at an option’s expiration.

Key Points

•   Max pain is the strike price resulting in the highest losses for option buyers at expiration.

•   Stock prices might move toward the max pain price as expiration approaches.

•   Calculating max pain involves assessing the dollar value of open interest for calls and puts at each strike.

•   Advantages include systematic trading and potential benefits from market behavior, but disadvantages exist.

•   Controversies arise from potential market manipulation by large institutions to influence stock prices.

What Is Max Pain?

Max pain, or the maximum pain price, is the strike price with the most open options contracts combining puts and calls.It is the strike price where the greatest number of options will expire out of the money, or worthless, causing the highest dollar value of losses among option buyers on a given stock at a specific expiration.

Some large institutional options sellers see an investment opportunity in writing options that eventually expire worthless, according to max pain theory. If options expire worthless, the seller of those options keeps the entire premium as profit. Option sellers face significant risk with this strategy, as they are obligated to fulfill the contract’s terms if exercised.

Max pain options trading stems from the Maximum Pain Theory. The theory contends that option sellers seek to hedge portfolios with options expiration. The Maximum Pain Theory also suggests an option’s price will arrive at a max pain price where the most options contracts held through expiration will experience losses. Bear in mind that an options contract that is not “in the money” at expiration is worthless.

Recommended: Popular Options Trading Terminology to Know

How Max Pain Works

The Maximum Pain Theory asserts that the price of the underlying asset is likely to converge at the maximum pain strike price. The max pain price is the strike with the greatest dollar value of calls and puts. As the expiration date approaches, the underlying stock price might “pin” to that option strike price.

Some day traders closely monitor the max pain price on the afternoon of expiration – usually the third Friday of the month for monthly options or each Friday for weekly options contracts.

Max Pain trading can be controversial, with some critics suggesting that attempts to influence stock prices near expiration could raise regulatory concerns (or even be considered market manipulation). Market participants disagree about whether or not Max Pain Theory works in practice. If a trader can predict which strike price will feature the greatest combination of dollar value between calls and puts, the theory states that they could profit from using that information.

Some market makers may consider Max Pain Price Theory when hedging their portfolios. Delta hedging is a strategy used by options traders — often market makers — to reduce the directional risk of price movements in the security underlying the options contracts. A market maker is often the seller of options contracts, and they seek to hedge the risk of options price movements by buying or selling underlying shares of stock.

This activity can cause the stock price to converge at the max pain price. Delta hedging plays a significant role in max pain trading.

How to Calculate the Max Point

Calculating the max pain options price is relatively straightforward if you have the data. Follow these steps to determine the max pain strike:

•   Step 1: Calculate the difference between each strike price and the underlying stock price.

•   Step 2: Multiply the difference calculated in Step 1 by the open interest for calls and puts at each strike price, determining the dollar value at that strike.

•   Step 3: Add the dollar value for both the put and the call at each strike.

•   Step 4: Repeat Steps 1 through 3 for each strike price on the option chain.

•   Step 5: The strike price with the highest dollar value of puts and calls is the max pain price.

Since the stock price constantly changes and open interest in the options market rises and falls, the max pain price can change daily. An options trader might be interested to see if there is a high amount of open interest at a specific price as that price could be where the underlying share price gravitates toward at expiration, at least according to Max Pain Theory.

Max Pain Point Example

Let’s imagine that a stock trades at $96 a week before options expiration. A trader researches the option chain on the stock and notices a high amount of open interest at the $100 strike. The trader performs the steps mentioned earlier to calculate the max pain price.

It turns out that $100 is, in fact, the max pain price. Since the trader believes in Max Pain Theory, they go long on shares of the stock, assuming that it will rise to $100 by the next week’s options expiration. Another options trading strategy could be to put on a bullish options position instead of buying shares of the underlying stock.

This hypothetical example looks simple on paper but many factors influence the price of a stock. For instance, there could be company-specific news issued during the final days before expiration that sends a stock price significantly higher or lower.

Macro factors and overall market momentum may affect stock prices, potentially reducing the influence of max pain dynamics. Finally, stock price volatility could cause the max pain price to shift in the hours and even minutes leading up to expiration.

Pros and Cons of Using Max Pain Theory When Trading

Max Pain Options Theory can be an effective strategy for options traders looking for a systematic approach for their options strategy. That said, not everyone agrees that Max Pain Theory works in practice. Here are some of the pros and cons of Max Pain Theory.

thumb_up

Pros:

•   A systematic approach to trading options

•   Trades the most liquid areas of the options market

•   May benefit from price trends tied to behavior of other market participants

thumb_down

Cons:

•   Lack of agreement supporting the theory

•   Stock prices don’t always gravitate to a max pain price

•   Other factors, such as market momentum or company news, could move the stock price

Options trading has become more accessible today due to low or no commission online investing. Previously, higher transaction costs made options trading less feasible for retail traders with smaller account sizes. It was not economical for average retail traders with small account sizes to buy and sell options using max pain theory.

Critics contend that there should be more regulatory oversight on max pain price trading — particularly on large institutions that could be manipulating prices. The regulatory future for these practices remains uncertain.

The Takeaway

Max Pain Theory is a framework in options trading that focuses on strike price, which may potentially result in the most losses for buyers at expiration. Options traders who calculate the max pain price, can use that information to inform their investing strategy, but outcomes are not guaranteed. While investors are not able to sell options on SoFi’s options trading platform at this time, they can buy call and put options to try to benefit from stock movements or manage risk.

SoFi’s options trading platform offers qualified investors the flexibility to pursue income generation, manage risk, and use advanced trading strategies. Investors may buy put and call options or sell covered calls and cash-secured puts to speculate on the price movements of stocks, all through a simple, intuitive interface.

With SoFi Invest® online options trading, there are no contract fees and no commissions. Plus, SoFi offers educational support — including in-app coaching resources, real-time pricing, and other tools to help you make informed decisions, based on your tolerance for risk.

Explore SoFi’s user-friendly options trading platform.

FAQ

What does max pain indicate?

Max pain indicates a specific strike price — specifically, It is the strike price that causes the highest dollar value of losses among option buyers on a given stock at a specific expiration.

What is max pain manipulation?

Some suggest that the max pain theory is related to market makers manipulating the overall options market, in an attempt to make the most number of options possible expire worthless.


Photo credit: iStock/valentinrussanov

INVESTMENTS ARE NOT FDIC INSURED • ARE NOT BANK GUARANTEED • MAY LOSE VALUE

SoFi Invest is a trade name used by SoFi Wealth LLC and SoFi Securities LLC offering investment products and services. Robo investing and advisory services are provided by SoFi Wealth LLC, an SEC-registered investment adviser. Brokerage and self-directed investing products offered through SoFi Securities LLC, Member FINRA/SIPC.

For disclosures on SoFi Invest platforms visit SoFi.com/legal. For a full listing of the fees associated with Sofi Invest please view our fee schedule.

Financial Tips & Strategies: The tips provided on this website are of a general nature and do not take into account your specific objectives, financial situation, and needs. You should always consider their appropriateness given your own circumstances.

Options involve risks, including substantial risk of loss and the possibility an investor may lose the entire amount invested in a short period of time. Before an investor begins trading options they should familiarize themselves with the Characteristics and Risks of Standardized Options . Tax considerations with options transactions are unique, investors should consult with their tax advisor to understand the impact to their taxes.


¹Probability of Member receiving $1,000 is a probability of 0.026%; If you don’t make a selection in 45 days, you’ll no longer qualify for the promo. Customer must fund their account with a minimum of $50.00 to qualify. Probability percentage is subject to decrease. See full terms and conditions.

SOIN-Q125-107

Read more
Exercising in Options? What Does It Mean & When to Exercise

Exercising in Options Trading: What It Means


Editor's Note: Options are not suitable for all investors. Options involve risks, including substantial risk of loss and the possibility an investor may lose the entire amount invested in a short period of time. Please see the Characteristics and Risks of Standardized Options.

Investors in stock option contracts have the right to buy or sell underlying stocks (or other assets) at a predetermined price within a certain time period. When an investor decides they want to take action on their right to buy or sell, it’s called exercising. There are a number of ways investors can choose to exercise their options contract, depending on their individual goals and financial situation.

Option contracts are complex investment vehicles. They’re a multi-faceted tool that involves precise timing and strategizing. While options are not for all investors, if handled by experienced traders, options could be beneficial for those who understand the risks involved.

Key Points

•   Exercising an option involves buying or selling the underlying security at the strike price.

•   Call options allow underlying assets to be purchased at a potentially lower price; put options allow underlying assets to be sold at a potentially higher price.

•   Options contracts have a limited lifespan; unexercised options contracts expire without value.

•   Consider transaction costs, time value, intrinsic value, and risk tolerance before exercising.

•   Many options are sold before expiration to capture remaining time value or to avoid exercise costs, but those that remain unexercised by expiration will expire worthless.

What Does Exercise Mean in Options Trading?

Exercising a stock option means that a trader purchases or sells the underlying stock associated with the options contract at the price set by the contract, which is called the strike price. This price may differ from the current market price of the stock.

Options contracts are valid for a certain amount of time in options trading. So if the owner doesn’t exercise their right to buy or sell within that period, the contract expires worthless, and the owner loses the right to buy or sell the underlying security at the strike price.

There is also an upfront fee in options trading, called a premium, that gets paid when a trader enters into an options contract. If the trader doesn’t exercise the contract, they forfeit that fee along with any other brokerage fees. Most options contracts never get exercised. Some contracts are sold instead of exercised, because the contract itself has value if it has the potential to be exercised later.

There are two main choices of types of options contracts, call options and put options. Purchasing a call option gives the buyer the right, but not the obligation, to purchase the underlying security at the strike price. Purchasing a put option gives the buyer the right, but not the obligation, to sell the underlying security at the strike price.

Each contract is different, and there are also different types of options. American-style options let traders exercise them at any time up until and on the contract’s expiration date, while European-style options can only be exercised on the expiration date itself.

Finally, user-friendly options trading is here.*

Trade options with SoFi Invest on an easy-to-use, intuitively designed online platform.


How Exercising a Call or Put Option Works

Generally, traders have several choices when it comes to exercising their stock options. When a trader is ready to exercise an option, they can let their brokerage firm know. The broker will create an exercise notice to the Options Clearing Corporation (OCC) to let the individual or entity buying or selling the underlying stock know that the trader wants to execute a trade on a particular date. The option seller is required to fulfill the obligations of the contract.

The OCC assigns the exercise notice to one of their clearing members, often the trader’s brokerage firm. The broker then assigns the option to one of their customers who has written an option contract that they have not yet covered. Depending on the broker, the customer they choose may either be chosen randomly or picked on a first-in-first-out (FIFO) principle.

Exercise a Call


Exercising a call option means buying the underlying stock at the option’s strike price. If the stock’s market price is higher than the strike price, you can purchase it at a discounted rate. The key benefit of exercising a call is potential access to those lower rates, especially if the stock has risen significantly. Transaction costs, such as brokerage commissions, can erode potential profits — so consider these factors when deciding to exercise.

For example, say that an investor buys a call option with a strike price of $50. If the stock’s market price rises to $60, they can exercise the option to buy shares at $50 instead of the higher market price. This gives them a $10 per share gain before factoring in the cost of the option and fees. If they don’t want to buy the shares, they could sell the option for a profit instead.

Exercise a Put


Exercising a put option means selling the underlying stock at the strike price. This can be beneficial if the market price falls below the strike price. You can then sell the stock at a higher price than the market price in order to see a profit. Bear in mind that selling a put obligates the seller to buy the underlying asset at the strike price if the option is exercised. There are also brokerage fees associated with exercising a put to consider, as there are with calls.

Say an investor buys a call option with a strike price of $50. If the stock’s market price rises to $60, they can exercise the option to buy shares at $50 instead of the higher market price. This gives them a $10 per share gain before factoring in the cost of the option and fees. If they don’t want to buy the shares, they could sell the option for a profit instead.

How Do You Know Whether to Hold or Exercise an Option?

It can be difficult to know when and whether to exercise an option. There are different options trading strategies that can prove beneficial to exercising early, or to waiting or even selling the option contract itself. Many factors come into play when making the decision to exercise an option, such as:

•   Time Value: Understanding how options pricing works is essential, as time value plays a key role in deciding whether to hold or exercise an option. Time value is a critical aspect of options pricing and significantly impacts the decision to. Options may lose value as they approach expiration due to the time decay. If there’s still significant time left on the option, it may be beneficial to hold the option rather than exercising it since it has the potential to be profitable over time. On the other hand, selling could help you capitalize on the remaining time value, since an option with, say, two months left to expiration would have more time value than an option with two weeks left to expiration.

•   Intrinsic Value (In-the-Money or Out-of-the-Money): The decision to exercise is often influenced by whether the option is in-the-money. A call option, for example, is in-the-money when the underlying asset’s price is above the strike price. Exercising in such a case allows the trader to buy the underlying asset at a discount. On the other hand, out-of-the-money options hold no intrinsic value and are unlikely to be exercised.

•   Transaction Costs and Fees: Exercising an option comes with transaction costs, which can include brokerage commissions and fees. These fees can erode profits, so it’s important to weigh them against potential gains from exercising. In some cases, the cost of exercising an option may outweigh the benefit, especially when the option is close to expiration and there are minimal profits to be gained.

•   Risk and Margin Exposure: There can be a significant amount of capital needed to purchase underlying assets, especially with high-priced stocks. This may also involve using a margin account, which increases your exposure to risk and any potential costs associated with holding the position. Be sure to assess your risk tolerance and available capital before deciding to exercise an option.

The Takeaway

When deciding to hold or exercise an option, the top factors are time value, intrinsic value, and your appetite for risk. Holding options could offer the potential for greater returns, but exercising options can provide profits if they are in-the-money. There are also fees and capital gains to consider.

While investors are not able to sell options on SoFi’s options trading platform at this time, they can buy call and put options to try to benefit from stock movements or manage risk.

SoFi’s options trading platform offers qualified investors the flexibility to pursue income generation, manage risk, and use advanced trading strategies. Investors may buy put and call options or sell covered calls and cash-secured puts to speculate on the price movements of stocks, all through a simple, intuitive interface.

With SoFi Invest® online options trading, there are no contract fees and no commissions. Plus, SoFi offers educational support — including in-app coaching resources, real-time pricing, and other tools to help you make informed decisions, based on your tolerance for risk.

Explore SoFi’s user-friendly options trading platform.

FAQ

How are early-exercise options different from exercise options?

Early-exercise options refer to American-style option contracts only, which can be exercised on and at any point before their expiration date. European-style options can only be exercised on their expiration date.

What is a cashless exercise in options?

A cashless exercise occurs when an investor purchases stock without paying cash to do so. The option holder pulls from some of the exercised shares to cover the cost of purchasing the stock. This is more common with employees exercising stock options, rather than in options trading.

What happens when you exercise an option?

Exercising an option means taking action on the right granted by your options contract. For call options, this means buying the underlying stock at the strike price. For put options, this means selling the underlying stock at the strike price. Exercising an option is a commitment to follow through with the contract’s terms: If you choose not to exercise the option, it will expire worthless, and you lose the premium paid to acquire it.

What happens to premium when you exercise a call option?

You do not keep your option premium when you sell a call option. The premium is part of the cost of acquiring the option, and is considered a sunk cost once the option is exercised.


INVESTMENTS ARE NOT FDIC INSURED • ARE NOT BANK GUARANTEED • MAY LOSE VALUE

SoFi Invest is a trade name used by SoFi Wealth LLC and SoFi Securities LLC offering investment products and services. Robo investing and advisory services are provided by SoFi Wealth LLC, an SEC-registered investment adviser. Brokerage and self-directed investing products offered through SoFi Securities LLC, Member FINRA/SIPC.

For disclosures on SoFi Invest platforms visit SoFi.com/legal. For a full listing of the fees associated with Sofi Invest please view our fee schedule.

Options involve risks, including substantial risk of loss and the possibility an investor may lose the entire amount invested in a short period of time. Before an investor begins trading options they should familiarize themselves with the Characteristics and Risks of Standardized Options . Tax considerations with options transactions are unique, investors should consult with their tax advisor to understand the impact to their taxes.

Disclaimer: The projections or other information regarding the likelihood of various investment outcomes are hypothetical in nature, do not reflect actual investment results, and are not guarantees of future results.

Financial Tips & Strategies: The tips provided on this website are of a general nature and do not take into account your specific objectives, financial situation, and needs. You should always consider their appropriateness given your own circumstances.

Photo credit: iStock/whyframestudio
SOIN-Q125-094

Read more
TLS 1.2 Encrypted
Equal Housing Lender