
Pros & Cons of the FIRE Movement
Table of Contents
Many people dream of the day that they clock into work for the very last time. In most cases, we imagine that’ll be when we’re in our 60s. But what if you could take the freedom and independence of retirement and experience it 20 or 30 years earlier?
That’s the basic principle of the Financial Independence, Retire Early (FIRE) movement, a community of young people who aim to live a lifestyle that allows them to retire in their 50s, 40s, or even 30s rather than their 60s or 70s.
While it may sound like the perfect life hack, attempting to live out this dream comes with some serious challenges. Read on to learn more about the FIRE movement and some techniques followers have used to help achieve their goal of early retirement. That can help you determine whether any of their savings strategies might be right for you.
Key Points
• FIRE stands for Financial Independence, Retire Early, with proponents aiming to retire earlier than the traditional time frame of 65 to 70 years-old.
• The movement originated from the book Your Money or Your Life in 1992, and gained traction in the 2010s.
• Achieving FIRE may require saving 50% to 75% of income and living frugally.
• Benefits include increased time flexibility, reduced financial stress, and a more passion-driven life.
• Drawbacks involve unpredictability, potential boredom, and challenges in re-entering the workforce.
What Is the FIRE Movement?
FIRE stands for “financial independence, retire early,” and it’s a movement where followers attempt to gain enough wealth to retire far earlier than the traditional timeline would allow.
The movement traces its roots to a 1992 book called Your Money or Your Life by Vicki Robin and Joe Dominguez. FIRE started to gain a lot of traction, particularly among millennials, in the 2010s.
In order to achieve retirement at such a young age, FIRE proponents may devote 50% to 75% of their income to savings. They also use dividend-paying investments in order to create passive income sources they can use to support themselves throughout their retired lives.
Of course, accumulating the amount of wealth needed to live for six decades or more without working is a considerable feat, and not everyone who attempts FIRE succeeds.
FIRE vs. Traditional Retirement
FIRE and traditional retirement both aim to help people figure out when they can retire, but there are major differences between the two.
Retiring Early
Given the challenge many people have of saving enough for retirement even by age 65 or 70, what kinds of lengths do the advocates of the FIRE movement go to?
Some early retirees blog about their experiences and offer tips to help others follow in their footsteps. For instance, Mr. Money Mustache is a prominent figure in the FIRE community, and advocates achieving financial freedom through, in his words, “badassity.”
His specific perspective includes reshaping simple but expensive habits, such as eliminating smoking cigarettes or drinking alcohol, and limiting dining out.
Of course, the basic premise of making financial freedom a reality is simple in theory: spend (much) less money than you make in order to accumulate a substantial balance of savings.
Investing those savings can potentially make the process more attainable by providing, in the best-case scenario, an ongoing passive income stream. However, many people who achieve FIRE are able to do so in part because of generational wealth or special circumstances that aren’t guaranteed.
For instance, Mr. Money Mustache and his wife both studied engineering and computer science and had “standard tech-industry cubicle jobs,” which tend to pay pretty well — and require educational and professional opportunities not all people can access.
In almost all cases, pursuing retirement with the FIRE movement requires a lifestyle that could best be described as basic, foregoing common social and leisure enjoyments like restaurant dining and travel.
Target Age for Early Retirement
Early retirement means different things to different people. While some individuals may consider age 55 to be an early retirement, many FIRE proponents aspire to retire in their 40s or even in their 30s, if possible.
According to a SoFi 2024 Retirement Survey, 12% of respondents say their target retirement age is 49 or younger. Of that group, 35% are using FIRE strategies to reach their goal, making it one of the top methods.
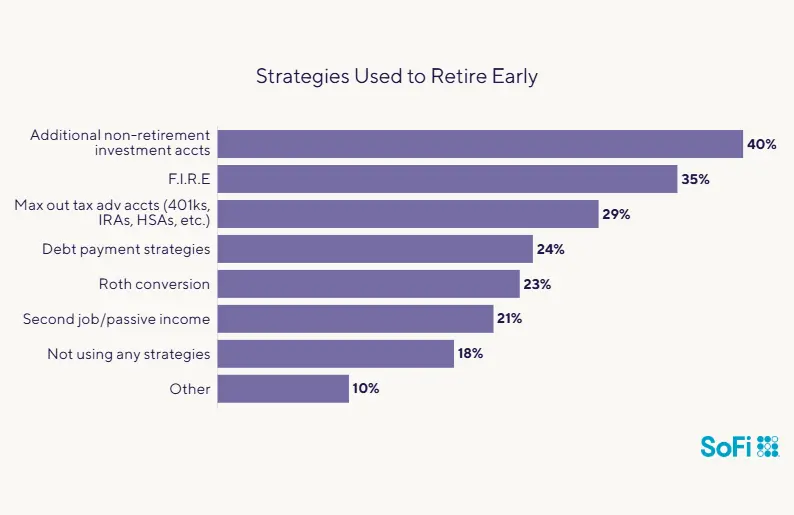
Source: SoFi Retirement Survey, April 2024
Saving Strategies for Retiring Early
Retiring early can involve making some serious adjustments to an individual’s current lifestyle. People who follow the FIRE movement generally try to put 50% to 75% of their income in savings. That can be challenging because once they pay their bills, there may not be much leftover for things like going to the movies or having dinner out.
As noted above, among the SoFi survey respondents, roughly one-third (35%) say they are using FIRE strategies.
Traditional Retirement
Most working people expect to retire sometime around the age of 65 or so. For those born in 1960 or later, Social Security benefits can begin at age 62, but those benefits will be significantly less than they would be if an individual waited until 67, their full retirement age, to collect them.
People saving for traditional retirement typically save much of their retirement funds in tax-incentivized retirement accounts, like 401(k)s and traditional IRAs, which carry age-related restrictions. For example, 401(k)s generally can’t be accessed before age 59½ without incurring a penalty.
But remember that even a traditional retirement timeline can be difficult for many savers. For example, the SoFi survey found that just 17% of respondents are saving 15% of their income for retirement, the amount many financial professionals recommend.
Online calculators and budgeting tools can help you determine when you can retire, and they are customizable to your exact retirement goals and specifications.
Financial Independence Retire Early: Pros and Cons
Although financial independence and early retirement are undoubtedly appealing, getting there isn’t all sunshine and rainbows. There are both strong benefits and drawbacks to this financial approach that individuals should weigh before undertaking the FIRE strategy.
Pros of the FIRE Approach
Benefits of the FIRE lifestyle include:
• Having more flexibility with your time. Those who retire at, say 45, as opposed to 65 or 70, have more of their lifetime to spend pursuing and enjoying the activities they choose.
• Building a meaningful, passion-filled life. Retiring early can be immensely freeing, allowing someone to shirk the so-called golden handcuffs of a job or career. When earning money isn’t the primary energy expenditure, more opportunities to follow one’s true calling can be taken.
• Learning to live below one’s means. “Lifestyle inflation” can be a problem among many working-age people who find themselves spending more money as they earn more income. The savings strategies necessary to achieve early retirement and financial independence require its advocates to learn to live frugally, or follow a minimalist lifestyle, which can help them save more money in the long run — even if they don’t end up actually retiring early.
• Less stress. Money is one of the leading stressors for many Americans. Gaining enough wealth to live comfortably without working could wipe out a major cause of anxiety, which could lead to a more enjoyable, and healthier, life.
Cons of the FIRE Approach
Drawbacks of the FIRE lifestyle include:
• Unpredictability of the future. Although many people seeking early retirement thoroughly map out their financial plans, the future is unpredictable. Social programs and tax structures, which may figure into future budgeting, can change unexpectedly, and life can also throw wrenches into the plan. For instance, a major illness or an unexpected life event could wreak havoc on even the best-laid plans for financial independence.
• Some find retirement boring. While never having to go to work again might sound heavenly to those on the job, some people who do achieve financial security and independence and take early retirement, struggle with filling their free time. Without a career or specific non-career goals, the years without work can feel unsatisfying.
• Fewer professional opportunities. If someone achieves FIRE and then discovers it’s not right for them — or they must re-enter the workforce due to an extenuating circumstance — they may find reintegration challenging. Without a history of continuous job experience, one’s skill set may not match the needs of the economy, and job searching, even in the best of circumstances, may be difficult.
• FIRE is hard! Even the most dedicated advocates of the financial independence and early retirement approach acknowledge that the lifestyle can be difficult — both in the extreme savings strategies necessary to achieve it and in the ways it changes day-to-day life. For instance, extroverts might find it difficult to forgo social activities like eating out or traveling with friends. Others may find it challenging to create a sense of personal identity that doesn’t revolve around a career.
Investing for FIRE
Investing allows FIRE advocates — and others — to earn income in two important ways: dividends and market appreciation.
Dividends
Shareholders earn dividend income when companies have excess profits. Dividends are generally offered on a quarterly basis, and if you hold shares of a stock you could earn them.
However, because dividend payments depend on company performance, they’re not guaranteed. Those relying on them to live should have other income sources (including substantial savings accounts) as a back up income stream.
Market Appreciation
Investors can also earn potential profits through market appreciation when they sell stocks and other assets for a higher price than what they initially paid for them.
Even for those who seek retirement at a traditional pace, stock investing is a common strategy to create the kind of compound growth over time that can build a substantial nest egg. There are many accounts built specifically for retirement investing, such as 401(k)s, IRAs, and 403(b) plans.
However, these accounts carry age-related restrictions and contribution limits which means that those interested in pursuing retirement on a FIRE timeline will need to explore additional types of accounts and saving and investing options.
For example, brokerage accounts allow investors to access their funds at any point — and to customize the way they allocate their assets to help support growth goals.
The Takeaway
Whether you’re hoping to retire in a traditional fashion, shorten your retirement timeline, or you’re simply looking to increase your wealth to achieve shorter-term financial goals, like buying a new car, investing can be an effective way to reach your objectives.
Invest in what matters most to you with SoFi Active Invest. In a self-directed account provided by SoFi Securities, you can trade stocks, exchange-traded funds (ETFs), mutual funds, alternative funds, options, and more — all while paying $0 commission on every trade. Other fees may apply. Whether you want to trade after-hours or manage your portfolio using real-time stock insights and analyst ratings, you can invest your way in SoFi's easy-to-use mobile app.
Opening and funding an Active Invest account gives you the opportunity to get up to $1,000 in the stock of your choice.¹
FAQ
What does “FIRE” stand for?
FIRE is an acronym that stands for “financially independent, retire early.” It’s a movement where followers try to save enough to retire much earlier than the traditional age, such as in their 30s and 40s rather than their 60s.
How many people are using FIRE strategies to save for retirement?
According to the SoFi 2024 Retirement Survey, 35% of those who wish to retire by age 50 are utilizing FIRE strategies to save for retirement.
What are some drawbacks of FIRE strategies?
Potential drawbacks of using FIRE strategies include the fact that saving so much and spending so little is very challenging, retirement may not be what many people envision once they achieve it, and the future is unpredictable, and their plans may change.
INVESTMENTS ARE NOT FDIC INSURED • ARE NOT BANK GUARANTEED • MAY LOSE VALUE
For disclosures on SoFi Invest platforms visit SoFi.com/legal. For a full listing of the fees associated with Sofi Invest please view our fee schedule.
¹Probability of Member receiving $1,000 is a probability of 0.026%; If you don’t make a selection in 45 days, you’ll no longer qualify for the promo. Customer must fund their account with a minimum of $50.00 to qualify. Probability percentage is subject to decrease. See full terms and conditions.
Disclaimer: The projections or other information regarding the likelihood of various investment outcomes are hypothetical in nature, do not reflect actual investment results, and are not guarantees of future results.
Financial Tips & Strategies: The tips provided on this website are of a general nature and do not take into account your specific objectives, financial situation, and needs. You should always consider their appropriateness given your own circumstances.
Third-Party Brand Mentions: No brands, products, or companies mentioned are affiliated with SoFi, nor do they endorse or sponsor this article. Third-party trademarks referenced herein are property of their respective owners.
Tax Information: This article provides general background information only and is not intended to serve as legal or tax advice or as a substitute for legal counsel. You should consult your own attorney and/or tax advisor if you have a question requiring legal or tax advice.
Third Party Trademarks: Certified Financial Planner Board of Standards Center for Financial Planning, Inc. owns and licenses the certification marks CFP®, CERTIFIED FINANCIAL PLANNER®
SOIN-Q325-004


